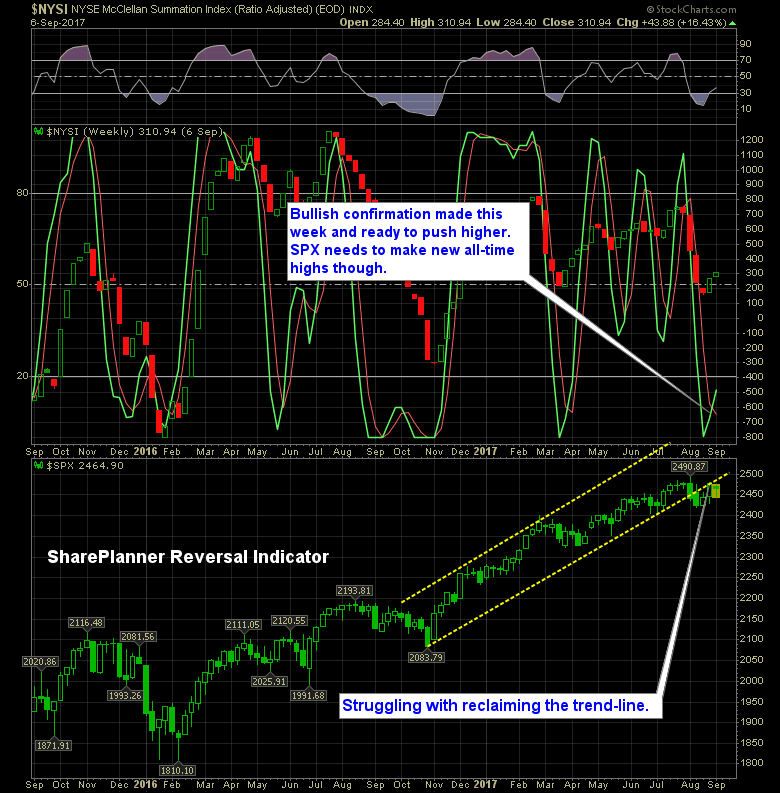
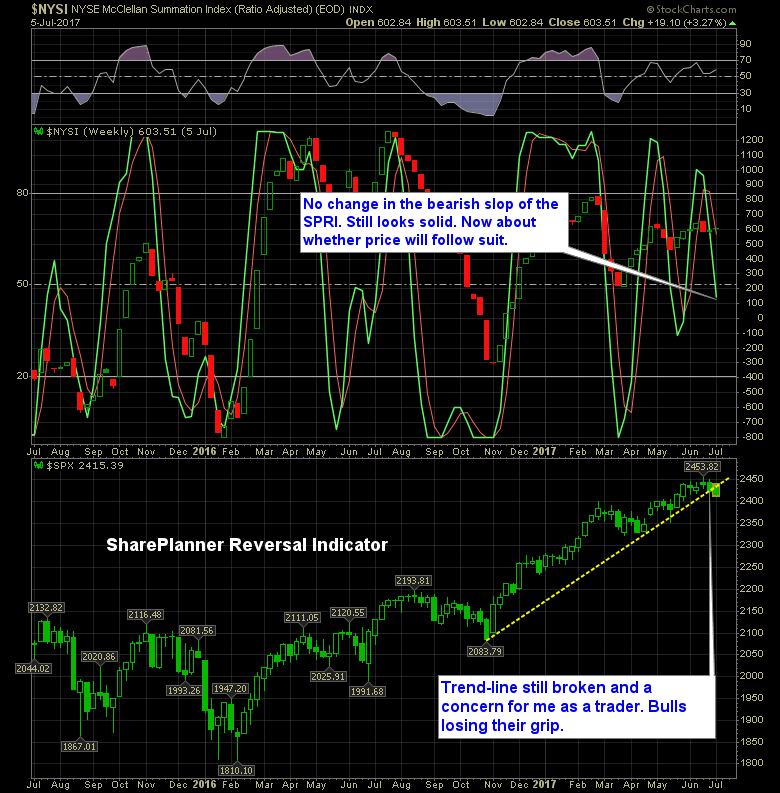
The SharePlanner Reversal Indicator (SPRI) is looking much more bullish these days. However, I believe in order for it to be taken the least bit serious, it needs the S&P 500 to push through resistance and on to new all-time highs.
The SharePlanner Reversal Indicator is lighting up with green. After a good solid month of August where price action spent most of its time in the red, the last three days have been uber-bullish for the S&P 500 (SPX) and may even finish in the green to close out the month, which would really be
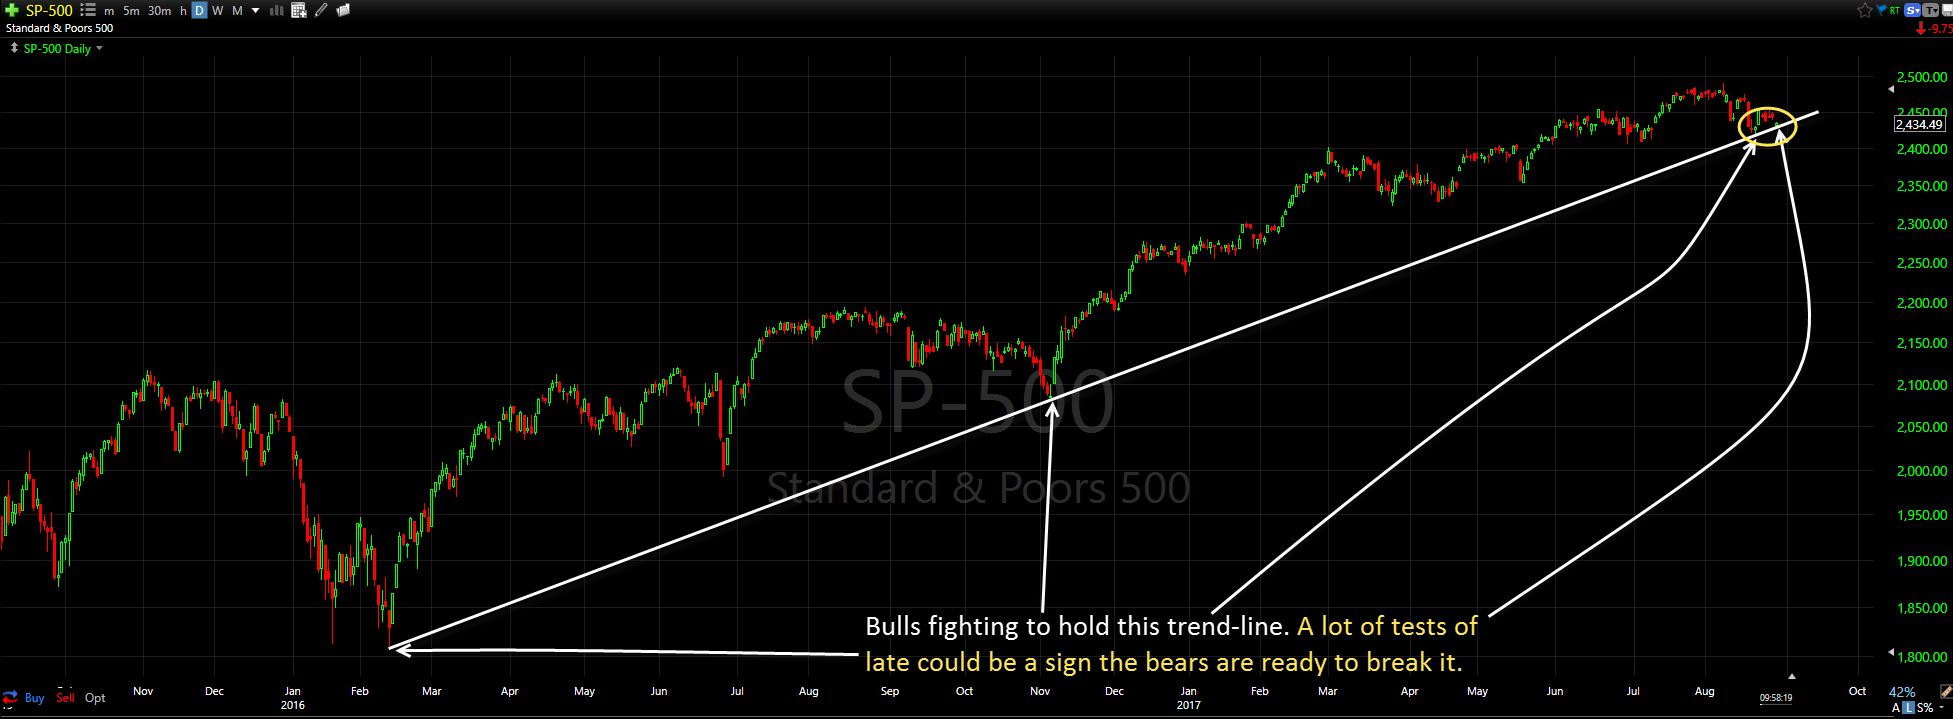
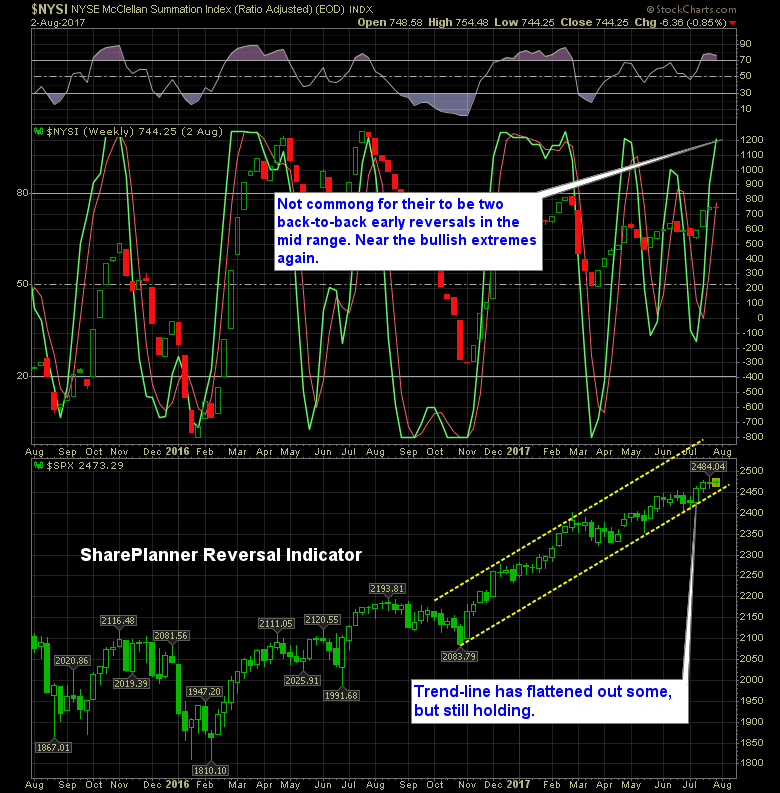
Stocks simply don’t want to give up this ride from the past 8 years. It can’t. IT WON’T! And that is because you have this massive long-term trend-line going back to February of last year that simply won’t break.
The daily chart on the S&P 500 (SPX) is an absolute mess. There isn’t really much to like about it in terms of determining future market direction.
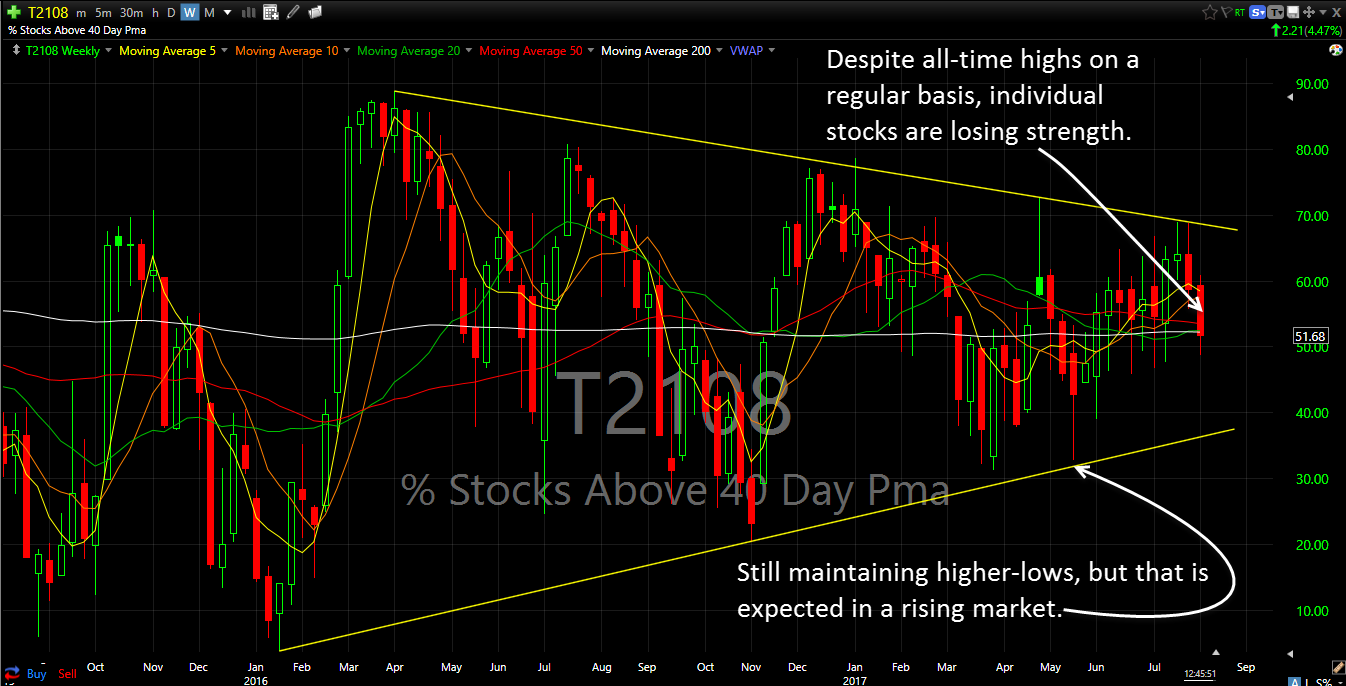
I use the T2108 to gauge the overall market enthusiasm and whether the stocks, as a whole, are really following what the market is telling us. Just looking at the stock market indices, in particular the Dow Jones Industrial Average. Day after day, it makes new all-time highs. Each day it rides one or two
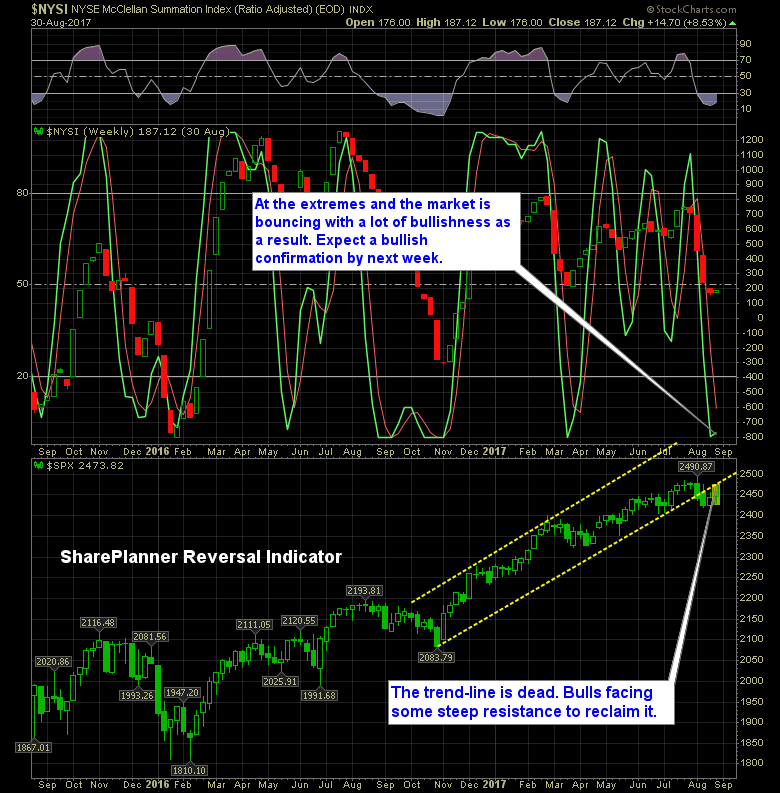
Nearing extremes again, but bulls refuse to break The bulls dip buy every chance they get. Regardless of the timeframe that you are looking at, any decline is met with instantaneous buying support. But where does it take us on the S&P 500 (I could careless about the Dow)?

Information received since the Federal Open Market Committee met in June indicates that the labor market has continued to strengthen and that economic activity has been rising moderately so far this year. Job gains have been solid, on average, since the beginning of the year, and the unemployment rate has declined. Household spending and business
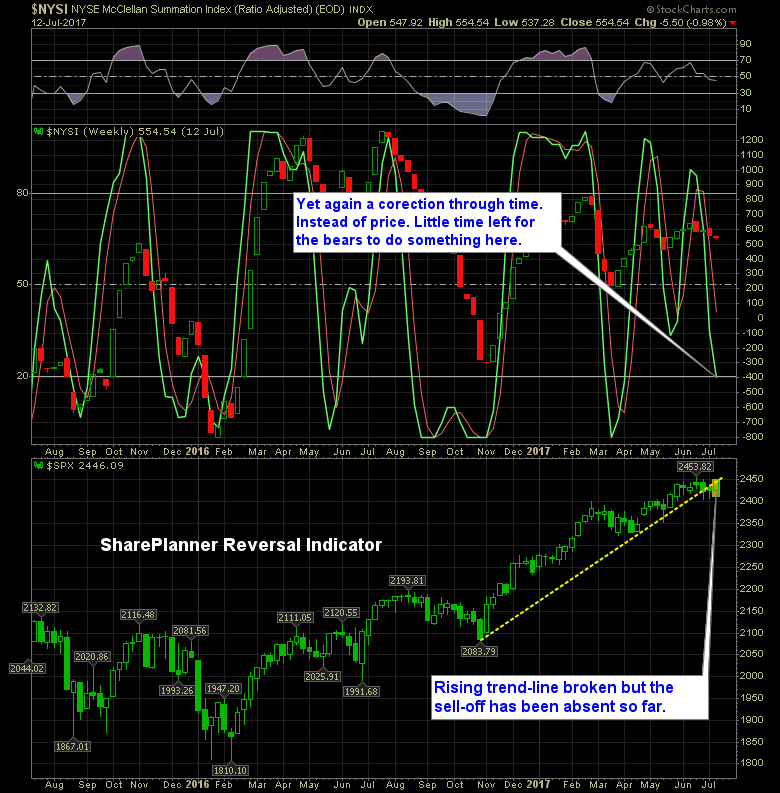
The market is gasping for air everytime it revisits the all-time highs that it made back in June. Yet the bears have yet to show up and relieve the market at current price levels that the bulls can’t seem to do anything with. As a result you have a stalemate. We got the bearish reversal
Breaking the 50-day Moving average may change the feel of this market all together. The 50-day moving average has held strong for this market since last year's election. There has been a few breaches around the 50-day MA, so it hasn't been a clean hold every time, but in large part, despite the breaks that
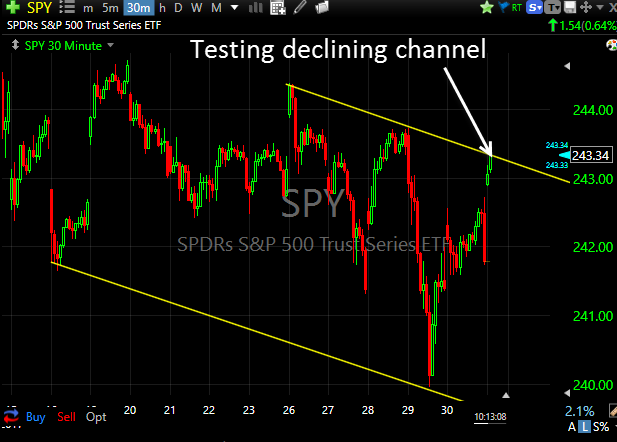
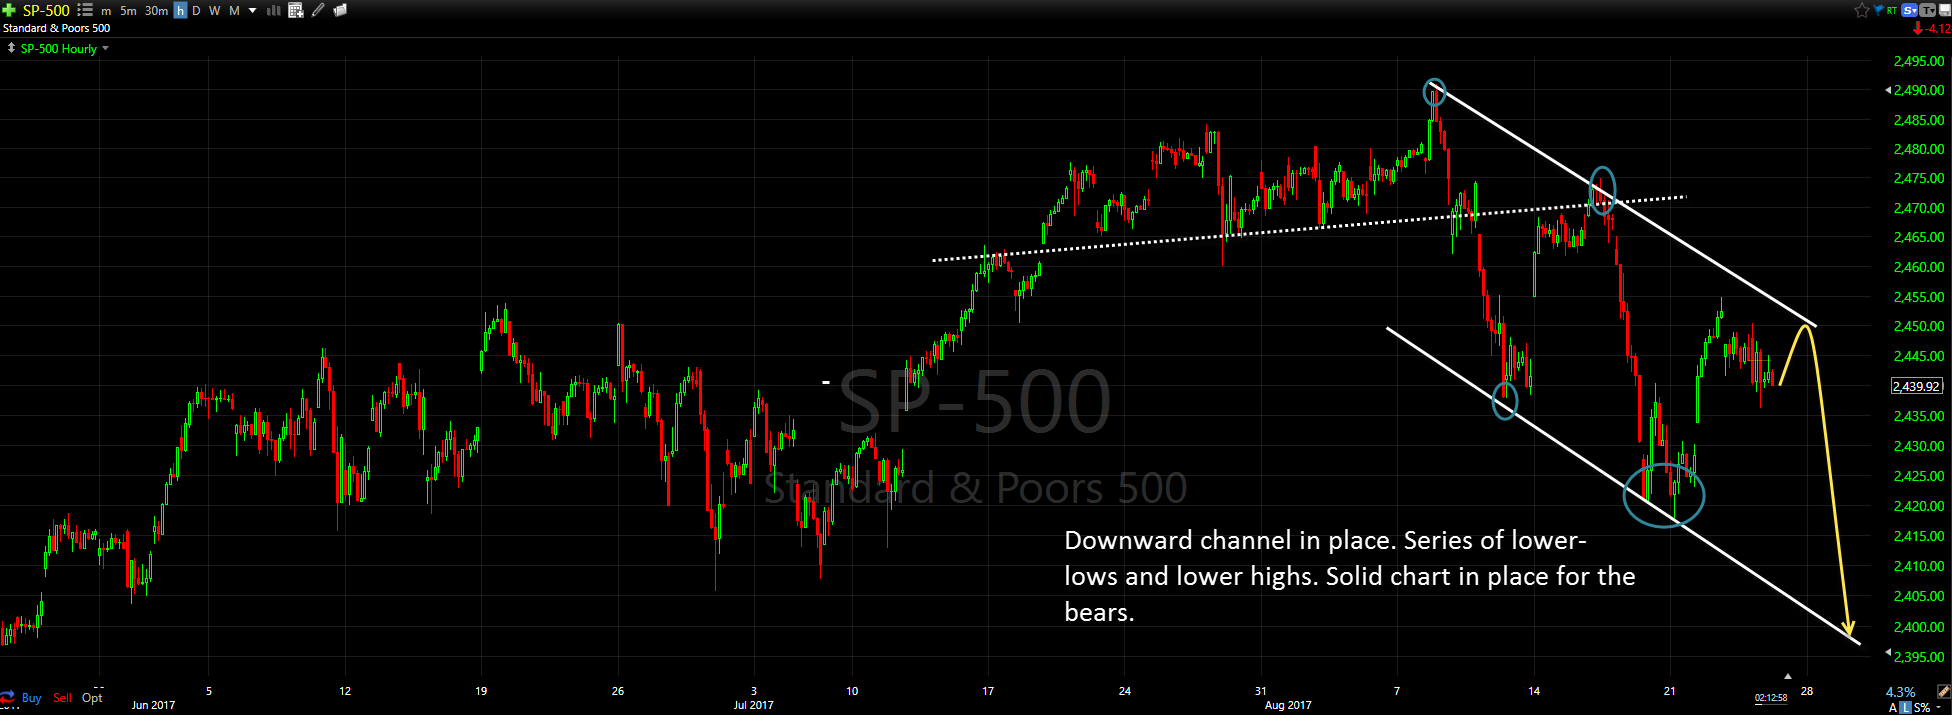
This channel continues to hold up amazingly well. Check it out for yourself. I posted it on Twitter this morning before the price rejection ever took hold.

spc@shareplanner.com
(904) 800-8420
© Copyright 2025 | SharePlanner Inc. All Rights Reserved.
Disclaimer: The information provided on this website is for educational and informational purposes only. Ryan Mallory and/or SharePlanner are not licensed financial advisors, brokers, or tax professionals. The content on this site should not be considered as financial, investment, tax, or legal advice.
All information and opinions expressed herein are based on sources believed to be accurate and reliable. However, we make no representation or warranty as to their accuracy, completeness, or reliability. Any action you take upon the information on this website is strictly at your own risk.
Past performance is not indicative of future results. Investing involves risk, including the possible loss of principal. All investors should make their own decisions based on their specific investment objectives and financial circumstances.
This site may contain links to external websites that are not provided or maintained by or in any way affiliated with Ryan Mallory and/or SharePlanner. Please note that Ryan Mallory and/or SharePlanner do not guarantee the accuracy, relevance, timeliness, or completeness of any information on these external websites.
By using this website, you agree that Ryan Mallory and/or SharePlanner and any affiliated parties are not responsible for any losses or damages resulting from your use of or reliance on the information provided.
It is strongly recommended that you consult with a qualified professional before making any financial decisions.