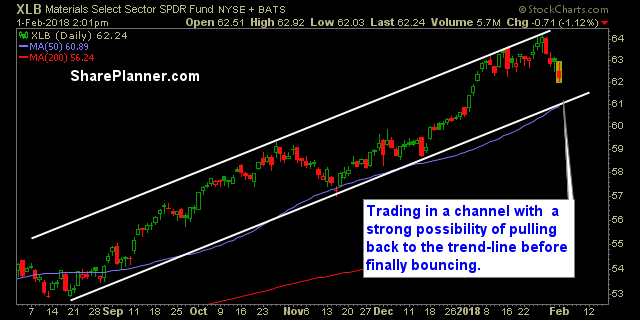
Beyond the technical analysis of the overall market, it is critically important to keep tabs on each sector, to know where the strength lies. For instance, had you invested in utilities over the past two months, you would be down royally, on your trade, while the rest of the market rallied. The same could be

Information received since the Federal Open Market Committee met in December indicates that the labor market has continued to strengthen and that economic activity has been rising at a solid rate. Gains in employment, household spending, and business fixed investment have been solid, and the unemployment rate has stayed low. On a 12-month basis, both
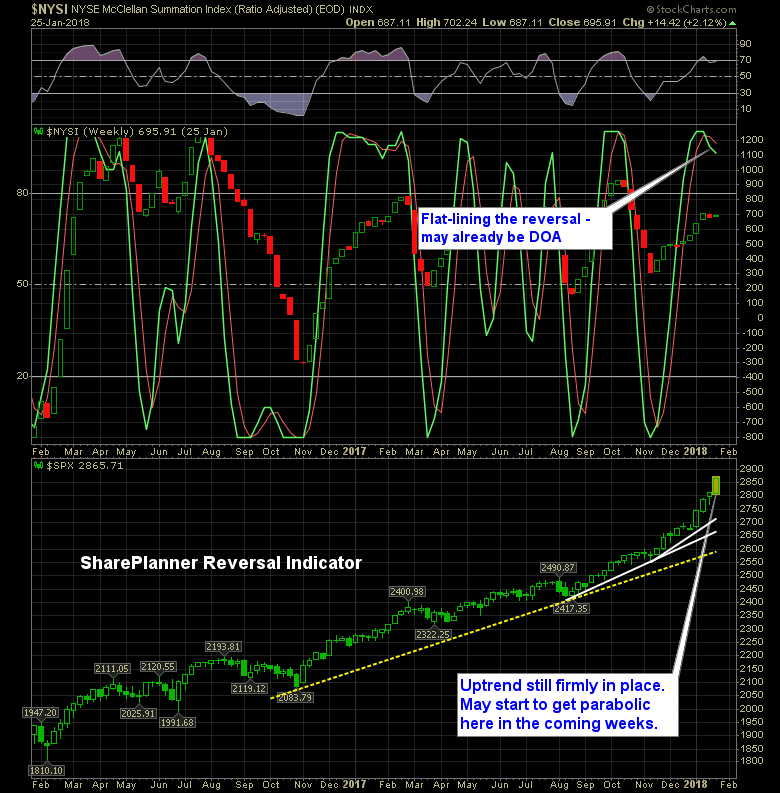
SharePlanner Reversal Indicator, following today’s rally is really going to be in some serious trouble. Up until today, there was some doubt developing, as the bulls continued to see their early morning profits slip into the red. But today, all is well in the market again, as it is now up 44% since Trump’s election.
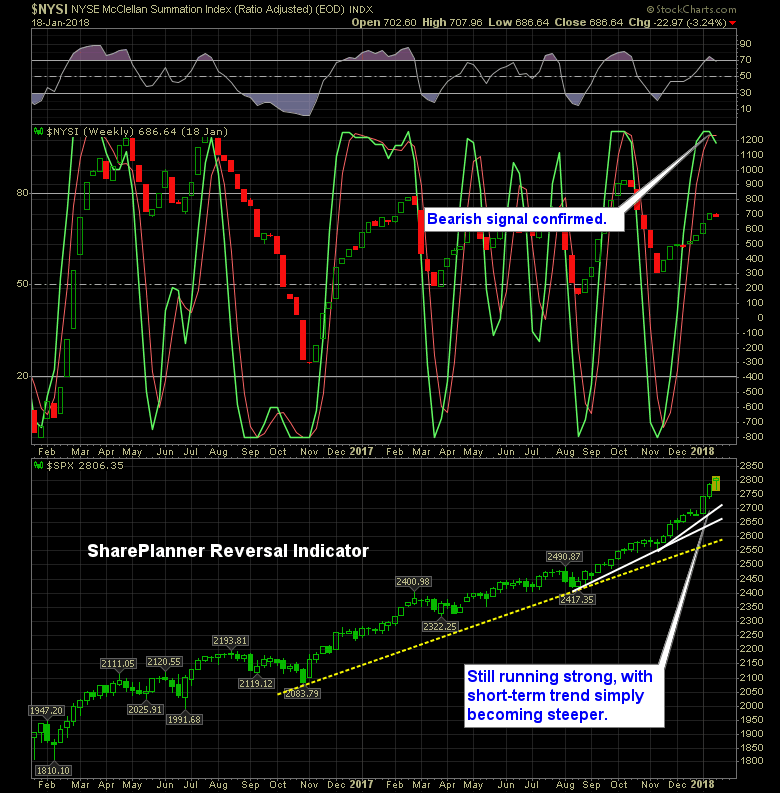
New Bearish Reversal on the SharePlanner Reversal Indicator Last time we had one of these was in October, and it doesn’t take a genius to recall how the market it did then, as stormed higher the entire time. But if you got back to the July/August reversal last year, the market actually traded lower during
Bulls still maintain full control. Heck, I am pretty sure when you have rallied eight of the first nine trading days of the year (SPX), you are in pretty good standing on the technical side of the trade.
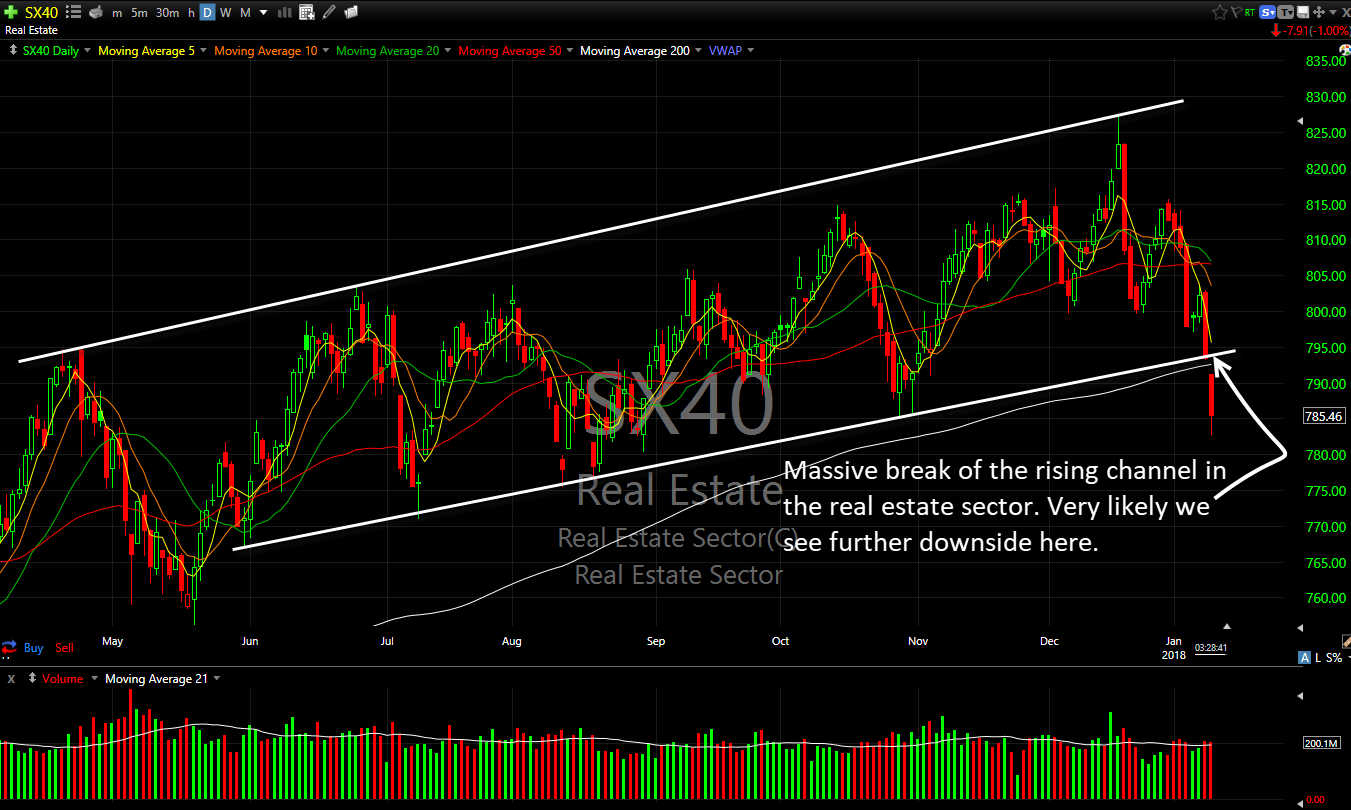
Corrections are 10% pull backs, Recessions are 20% sell-offs. So far the real estate sector has seen a decline of about 5%.
I’ve really been impressed by the start that we have seen here in 2018. Really an amazing start, and the best opening week that I can remember having to a new year, in a very, very long time. In fact it is the best opening week for the stock market since 2006.
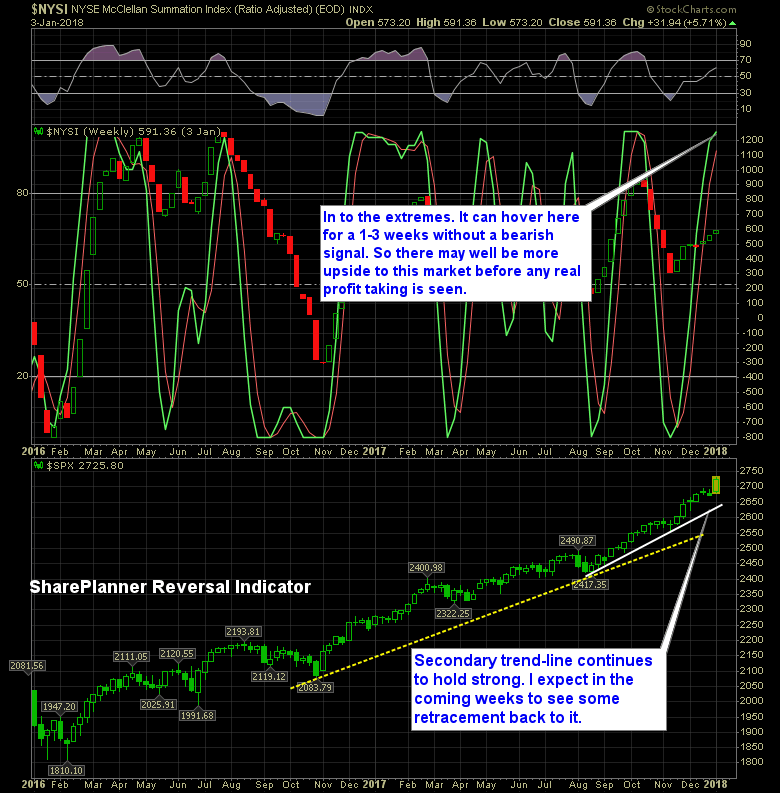
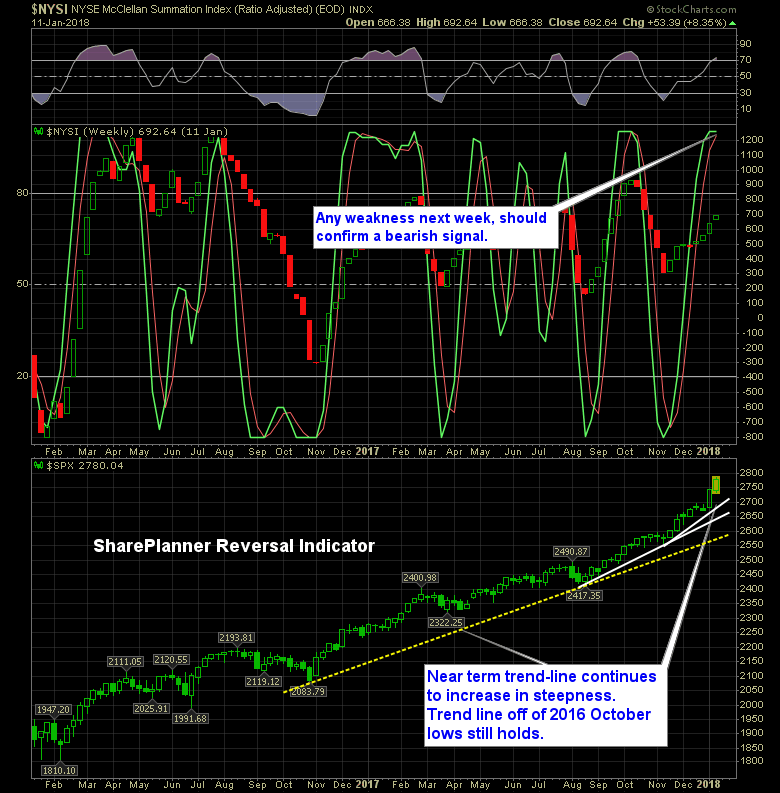
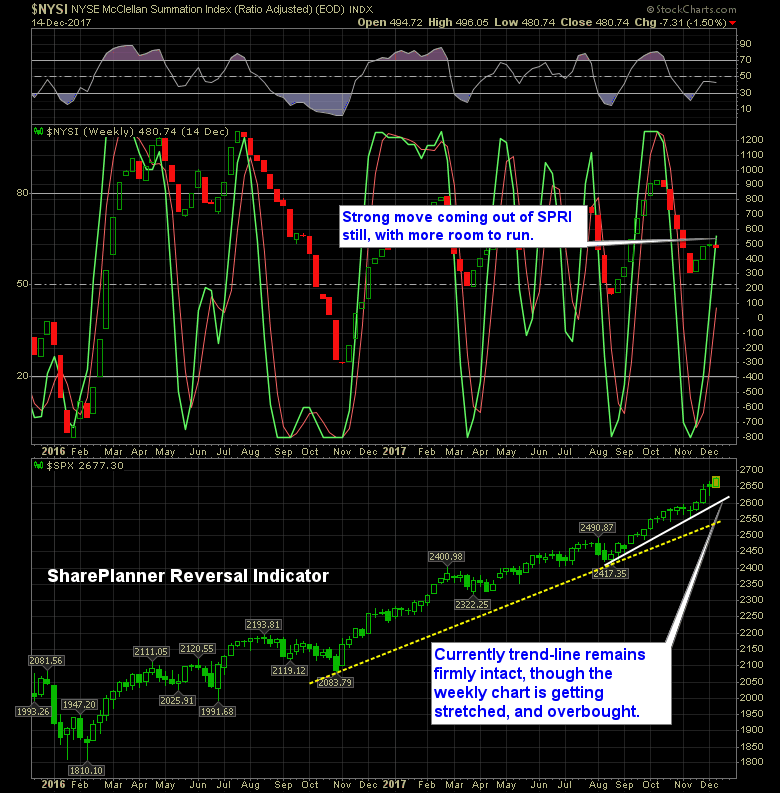
It’s Day 3 of 2018, and the market is still pumped about it’s prospects for finishing higher. The SharePlanner Reversal Indicator suggests that there is more upside to this market, though it does seem we are closer to a near-term top, than we are a bottom.
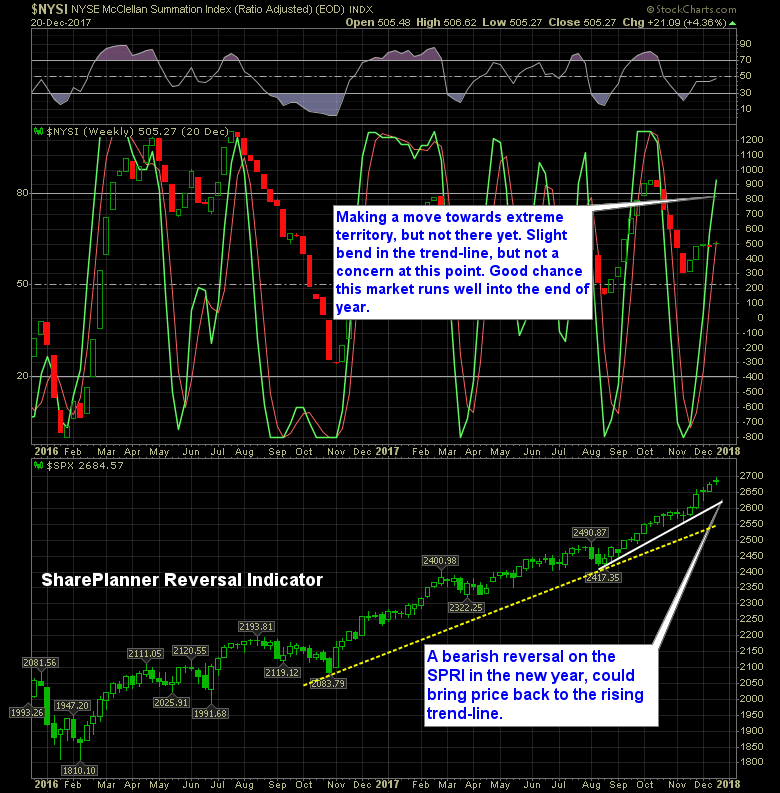
Based off of what the SharePlanner Reversal Indicator suggests, price action should be strong into the year-end.
Big run today out of the market, but according to the SharePlanner Reversal Indicator, there is more opportunity still to the upside. Yesterday’s perpetual sell-off, had me a bit concerned, enough where I added one short position to the portfolio, but immediately closed it out this morning at the open, once it looked like the

spc@shareplanner.com
(904) 800-8420
© Copyright 2025 | SharePlanner Inc. All Rights Reserved.
Disclaimer: The information provided on this website is for educational and informational purposes only. Ryan Mallory and/or SharePlanner are not licensed financial advisors, brokers, or tax professionals. The content on this site should not be considered as financial, investment, tax, or legal advice.
All information and opinions expressed herein are based on sources believed to be accurate and reliable. However, we make no representation or warranty as to their accuracy, completeness, or reliability. Any action you take upon the information on this website is strictly at your own risk.
Past performance is not indicative of future results. Investing involves risk, including the possible loss of principal. All investors should make their own decisions based on their specific investment objectives and financial circumstances.
This site may contain links to external websites that are not provided or maintained by or in any way affiliated with Ryan Mallory and/or SharePlanner. Please note that Ryan Mallory and/or SharePlanner do not guarantee the accuracy, relevance, timeliness, or completeness of any information on these external websites.
By using this website, you agree that Ryan Mallory and/or SharePlanner and any affiliated parties are not responsible for any losses or damages resulting from your use of or reliance on the information provided.
It is strongly recommended that you consult with a qualified professional before making any financial decisions.