
We’re heading into the close and the market is playing with the notion of closing below 1340. If we close below that I’ll be a little bit more comfortable about adding more of the short setups listed below. I’ve already added Sigma -Aldrich (SIAL) at $70.27. I was actually thinking the market might take a
I’m a bit mixed on this market. On one hand, I’m not finding a lot of short setups that aren’t already well over-extended, and too risky to be jumping in at this point, however, there’s enough resistance overhead on the S&P, where I’m skeptical of it rallying much and lifting some of these shorts off
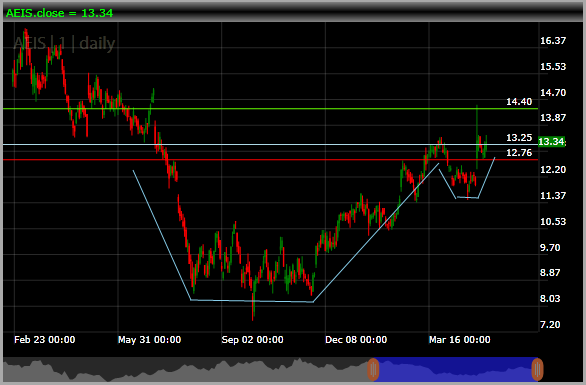
Only two new trades for me today, combined with my trade in USO, which has held up decently well, even though I am a bit under water on the position (in at $36.74). The first trade was AEIS at $13.25 with a stop at $12.76. I can’t take credit for this trade as @thetradingwife spotted

I took on four new trades today – two longs and two shorts. This brings me to a total of four longs and two shorts. I want to hedge myself a little still, because we haven’t broken out and above 1422 yet. I also closed out my trade in CLX for a 0.24% gain. Not

I’ve made four new trades today – two longs and two shorts. Only one of the long positions will I try to hold over the weekend. I’m pleased with the market action so far today – the bounce from the past two days went right into resistance and it seems like…at least for now…the bulls
I’m expecting that we’ll see a bounce in the market tomorrow. We’ve been down four straight days, and if recent history says anything, it says it has a very hard time going down a fifth straight day. I think the bulls will look to try and game this sell-off and see how much damage a
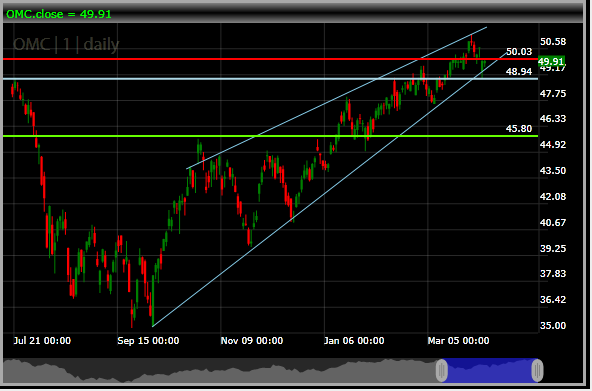
SHORT: Omnicom Group (OMC) – Rising bearish wedge. Provides a great short opportunity once it breaks below support noted below.

When we got the downside reversal signal in the SPRI a month ago, it turned out to be one of the few times since this indicator has been published where the market definantly continued to march higher. Now we are on the verge of another signal to the upside. What I am most curious about
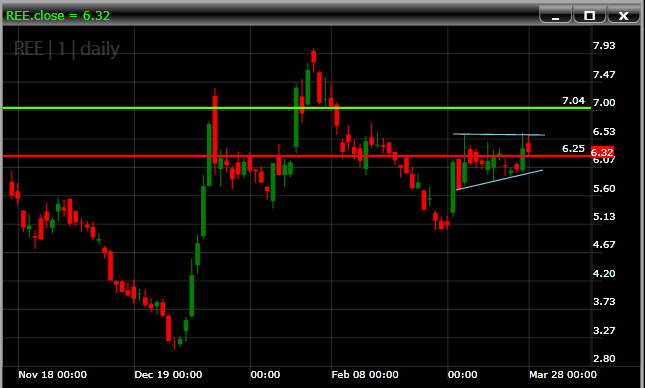
LONG: Rare Element Resources (REE) – Nice ascending triangle ready to breakout at around $6.63. Careful with the declining 200-day moving average, and look to take profits before then.
The biggest thing I’ve seen this morning is that despite a strong ISM Non-Manufacturing reading the market has essentially shrugged off the positive news. At this point, the market is beginning to remind me of that tired, cranky child, who, at the very least, needs a nap, but fights with everything it has to keep

spc@shareplanner.com
(904) 800-8420
© Copyright 2025 | SharePlanner Inc. All Rights Reserved.
Disclaimer: The information provided on this website is for educational and informational purposes only. Ryan Mallory and/or SharePlanner are not licensed financial advisors, brokers, or tax professionals. The content on this site should not be considered as financial, investment, tax, or legal advice.
All information and opinions expressed herein are based on sources believed to be accurate and reliable. However, we make no representation or warranty as to their accuracy, completeness, or reliability. Any action you take upon the information on this website is strictly at your own risk.
Past performance is not indicative of future results. Investing involves risk, including the possible loss of principal. All investors should make their own decisions based on their specific investment objectives and financial circumstances.
This site may contain links to external websites that are not provided or maintained by or in any way affiliated with Ryan Mallory and/or SharePlanner. Please note that Ryan Mallory and/or SharePlanner do not guarantee the accuracy, relevance, timeliness, or completeness of any information on these external websites.
By using this website, you agree that Ryan Mallory and/or SharePlanner and any affiliated parties are not responsible for any losses or damages resulting from your use of or reliance on the information provided.
It is strongly recommended that you consult with a qualified professional before making any financial decisions.