
Below are a series of chartgrids of the YM, ES, NQ & TF. I’ll provide a bit of commentary on each.
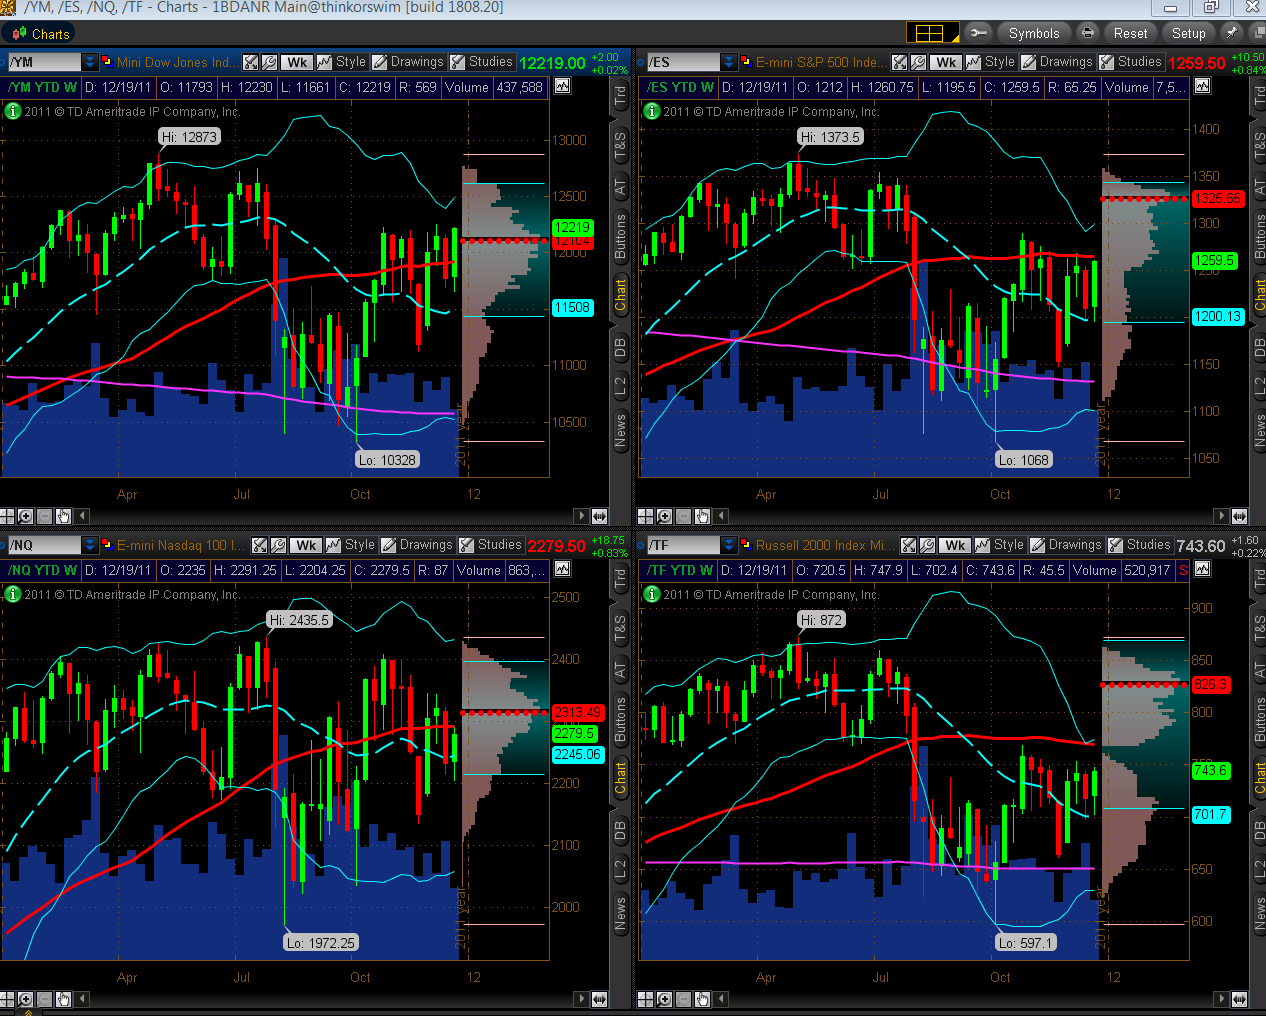
Year-to-date Weekly charts:
- Each e-mini futures index is either at or near a resistance confluence of price plus indicator
- YM is at Volume Profile POC, but trading above its mid-Bollinger Band and 50 sma (red)
- ES is at its 50 sma, above its mid-Bollinger Band, and below its POC
- NQ is at just below its POC and 50 sma, and above its mid-Bollinger Band
- TF is below its 50 sma, well below its POC, and above its mid-Bollinger Band
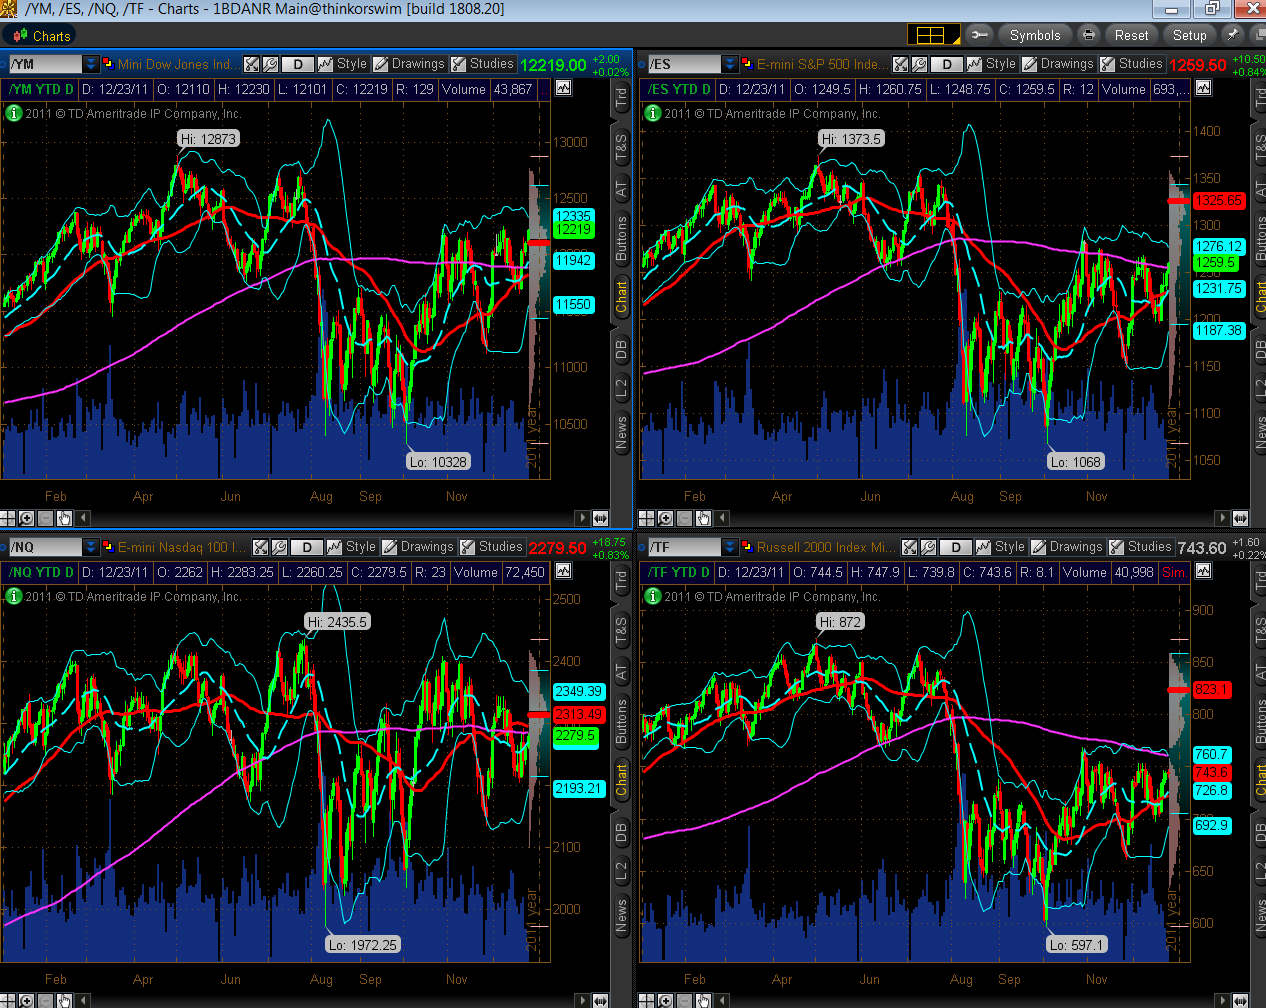
Year-to-date Daily charts:
- Each one is either at or near a resistance confluence of price plus indicator
- YM, ES & TF are still under the influence of the bearish moving average Death Cross formation
- YM is approaching its upper Bollinger Band, and is above its POC, 50 & 200 smas
- ES is just above its 200 sma (pink), is above its Mid-Bollinger Band and 50 sma, and is well below its POC
- NQ is just below its 200 and 50 smas, is just above its mid-Bollinger band, and is further below its POC
- TF is below its 200 sma, above its mid-Bollinger Band and 50 sma, and is well below its POC
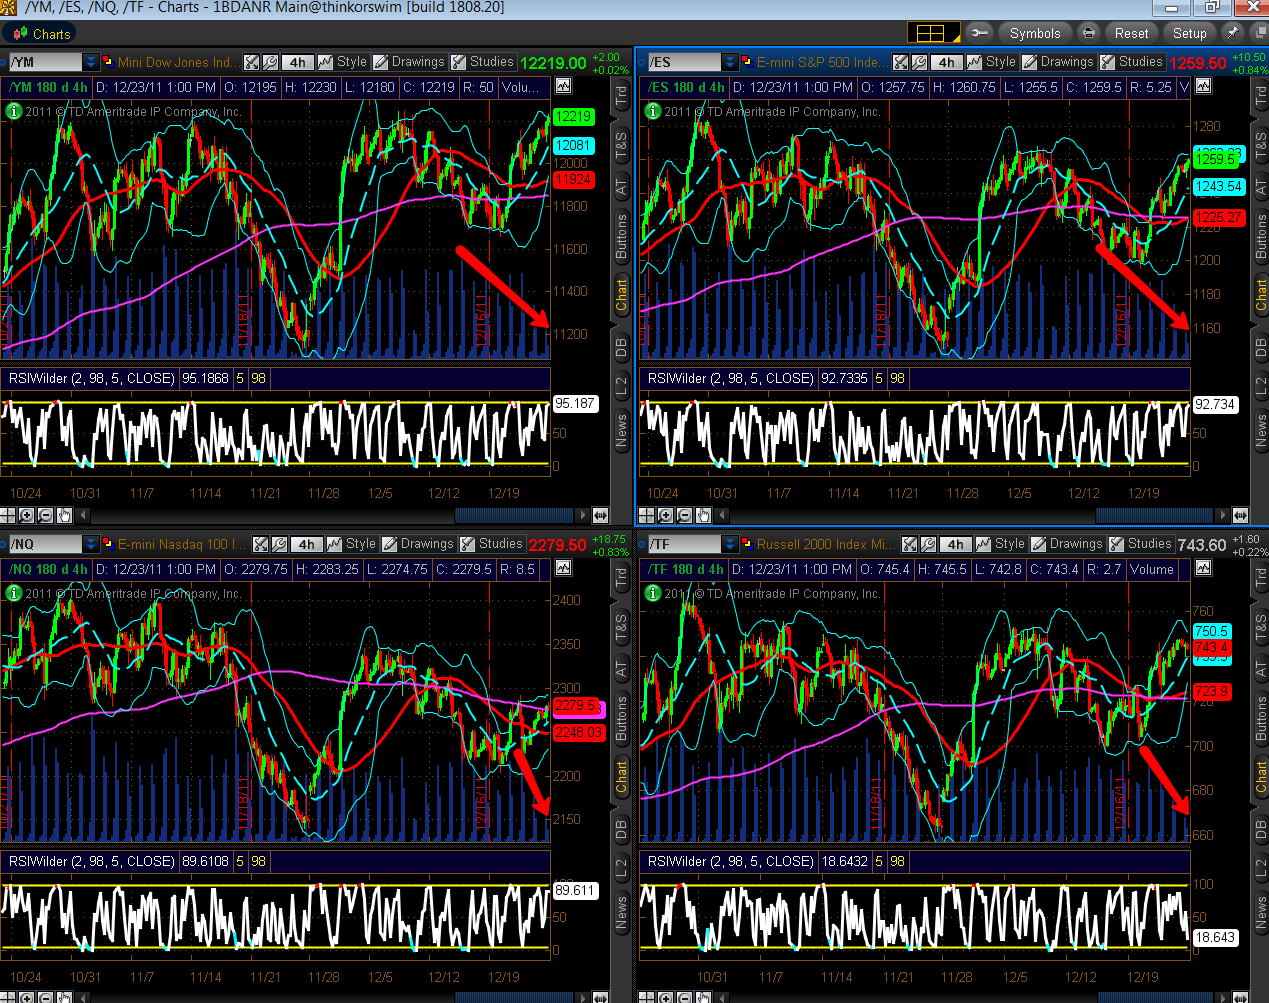
4-Hour charts:
- Each one is either at or near a resistance confluence of price plus indicator, and volumes have been steadily declining on this latest rally since their December lows
- YM is at its upper Bollinger Band and above the 50 & 200 smas
- ES is at its upper Bollinger Band and above the 50 & 200 smas…still under the influence of the bearish moving average Death Cross formation
- NQ is at its 200 sma and above its 50 sma, and in between its upper and mid-Bollinger Bands…still under the influence of the bearish moving average Death Cross formation
- TF is above both the 50 and 200 smas, and is in between its upper and mid-Bollinger Bands
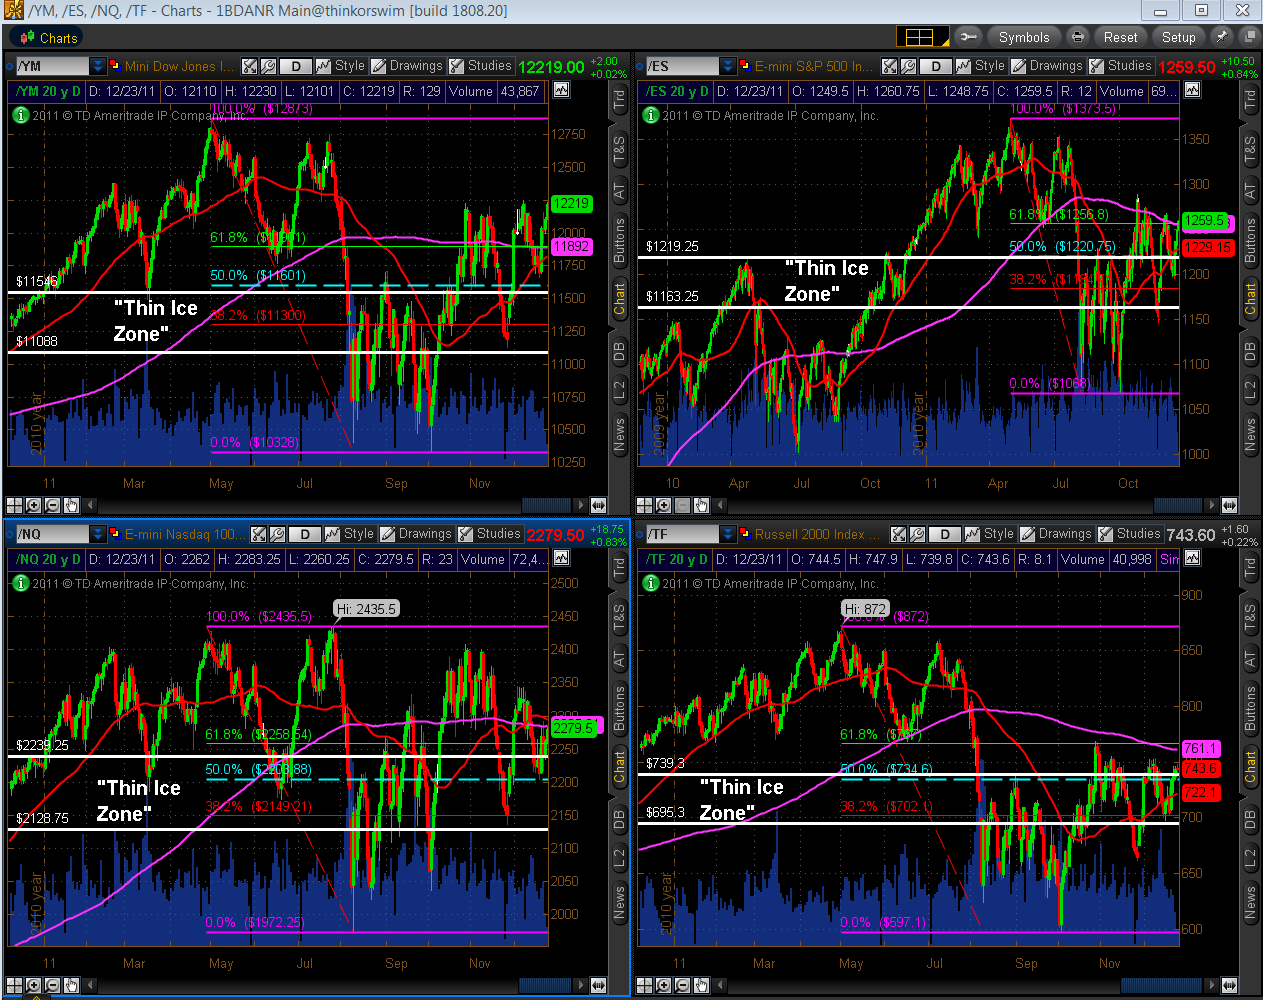
Year-to-date Daily charts:
- All are now trading above their “Thin Ice Zone”…the top and bottom levels are the high and low of the August 5th candles (the day of the U.S. credit rating downgrade)…I’ve written a number of posts on this zone and this one on December 14th explains: http://strawberryblondesmarketsummary.blogspot.com/2011/12/some-bears-are-still-awake.html
- YM is well above its 61.8% Fibonacci retracement level
- ES closed just above its 61.8% Fibonacci retracement level, once again
- NQ closed just above its 61.8% Fibonacci retracement level, once again
- TF closed just above its 50% Fibonacci retracement level, once again
20-Day 30-minute (market hours only) charts:
- Each one has several unfilled gaps from its November 25th swing low
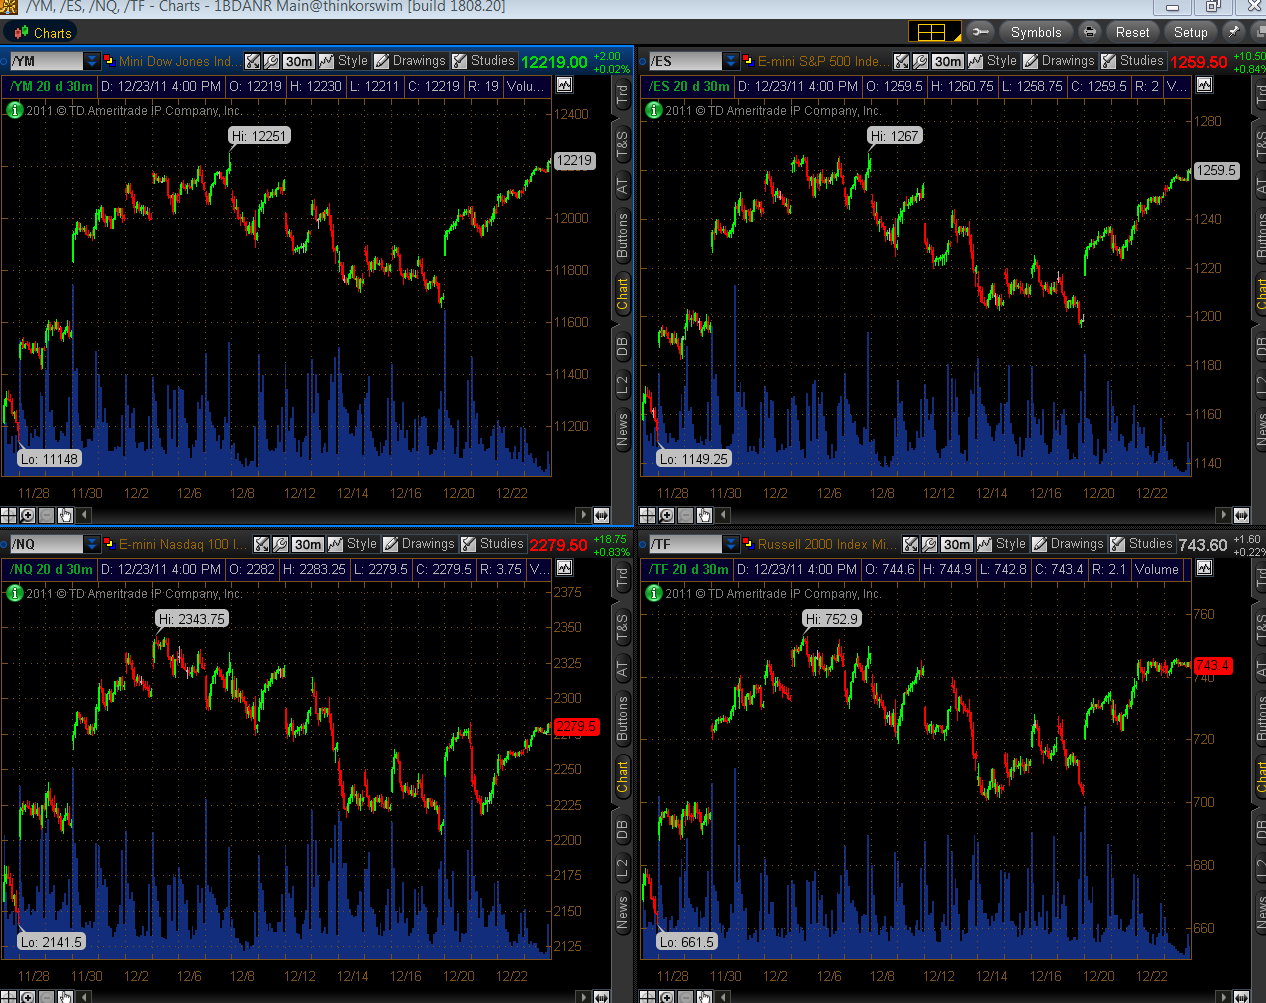
In conclusion, each one is at a level of confluence resistance. This latest rally has taken place on declining volumes. The rally from November 25th contains several unfilled gaps…these markets have only been able to rally within the “Thin Ice Zone” after gapping up on thinly-traded overnight pushes…a further and sustainable advance above their current price levels without, first, filling these gaps, is suspect.


Welcome to Swing Trading the Stock Market Podcast!
I want you to become a better trader, and you know what? You absolutely can!
Commit these three rules to memory and to your trading:
#1: Manage the RISK ALWAYS!
#2: Keep the Losses Small
#3: Do #1 & #2 and the profits will take care of themselves.
That’s right, successful swing-trading is about managing the risk, and with Swing Trading the Stock Market podcast, I encourage you to email me (ryan@shareplanner.com) your questions, and there’s a good chance I’ll make a future podcast out of your stock market related question.
Watching the dollars rise and fall in your trading account can turn a well-planned swing trade into an emotional, deeply personal decision. In this episode, I explain why focusing on price action, percentage returns, and R-multiples can help you avoid cutting winners early, holding losers too long, and abandoning your trading plan.
Be sure to check out my Swing-Trading offering through SharePlanner that goes hand-in-hand with my podcast, offering all of the research, charts and technical analysis on the stock market and individual stocks, not to mention my personal watch-lists, reviews and regular updates on the most popular stocks, including the all-important big tech stocks. Check it out now at: https://www.shareplanner.com/premium-plans
📈 START SWING-TRADING WITH ME! 📈
Click here to subscribe: https://shareplanner.com/tradingblock
— — — — — — — — —
💻 STOCK MARKET TRAINING COURSES 💻
Click here for all of my training courses: https://www.shareplanner.com/trading-academy
– The A-Z of the Self-Made Trader –https://www.shareplanner.com/the-a-z-of-the-self-made-trader
– The Winning Watch-List — https://www.shareplanner.com/winning-watchlist
– Patterns to Profits — https://www.shareplanner.com/patterns-to-profits
– Get 1-on-1 Coaching — https://www.shareplanner.com/coaching
— — — — — — — — —
❤️ SUBSCRIBE TO MY YOUTUBE CHANNEL 📺
Click here to subscribe: https://www.youtube.com/shareplanner?sub_confirmation=1
🎧 LISTEN TO MY PODCAST 🎵
Click here to listen to my podcast: https://open.spotify.com/show/5Nn7MhTB9HJSyQ0C6bMKXI
— — — — — — — — —
💰 FREE RESOURCES 💰
— — — — — — — — —
🛠 TOOLS OF THE TRADE 🛠
Software I use (TC2000): https://bit.ly/2HBdnBm
— — — — — — — — —
📱 FOLLOW SHAREPLANNER ON SOCIAL MEDIA 📱
*Disclaimer: Ryan Mallory is not a financial adviser and this podcast is for entertainment purposes only. Consult your financial adviser before making any decisions.
You Might Like

South Korea: The Hidden Driver of US Tech Volatility

Stop Trying to Hit Home Runs: Start Trading Within Your Means
How to Trade Breakouts Without Getting Trapped