
Pre-market update:
- Asian markets traded 0.6% higher.
- European markets are trading 0.2% higher.
- US futures are trading 0.1% higher ahead of the market open.
Economic reports due out (all times are eastern): MBA Purchase Applications (7), Current Account (8:30), EIA Petroleum Status Report (10:30), FOMC Meeting Announcement (2), FOMC Forecasts (20), Chair Press Conference (2:30)
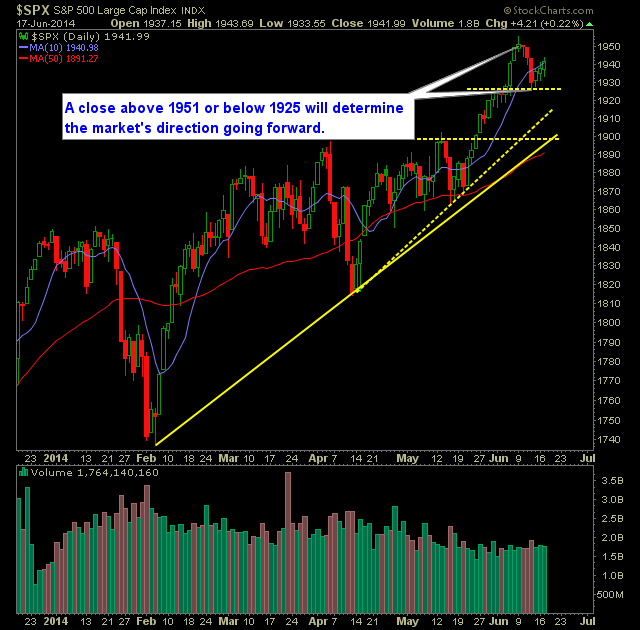
Technical Outlook (SPX):
- SPX pushed higher for a third straight day, though the gains were meager in as many days.
- One technical development was the reclaiming of the 10-day moving average.
- A push above 1951 would get the SPX into price expansion mode again, while a move below 1925 would create a new leg down in this market.
- Ultimately it needs to hold 1911 at all costs which represents the short-term rising trend-line off of the 4/14 lows.
- Volume levels are holding steady and just a shade below average levels, which is a lot better than what we have been seeing from the bulls.
- VIX saw a significant drop off yesterday in the VIX – back down to 12.06.
- FOMC Statement comes out today, but don’t expect any major changes to the previous statement. Always watch the first two price swings. The third price swing is usually the ultimate move that it takes.
- It doesn’t look like Iraq will play a large role in the market going forward. There doesn’t seem to be a lot of evidence that suggests Baghdad will fall to the ISIS. I think the events in Iraq has been more of an excuse for the markets to take profits than anything else.
- The market doesn’t care about the economy nor earnings. That is not what is driving it. The market only cares about what the Fed is doing to keep equities propped up.
My Trades:
- Closed out AKAM yesterday at $60.84 for a 11.6% gain.
- Closed out HAL yesterday at $67.51 for a 3.6% gain.
- I added one additional position yesterday (long).
- Remain long IR at 60.11, FB at 63.05, RVBD at 20.29, PAY at 36.91, NFLX at 428.56.
- 60% Long / 40% Cash
- Join me each day for all my real-time trades and alerts in the SharePlanner Splash Zone
Chart for SPX:


Welcome to Swing Trading the Stock Market Podcast!
I want you to become a better trader, and you know what? You absolutely can!
Commit these three rules to memory and to your trading:
#1: Manage the RISK ALWAYS!
#2: Keep the Losses Small
#3: Do #1 & #2 and the profits will take care of themselves.
That’s right, successful swing-trading is about managing the risk, and with Swing Trading the Stock Market podcast, I encourage you to email me (ryan@shareplanner.com) your questions, and there’s a good chance I’ll make a future podcast out of your stock market related question.
Refusing to take a loss when the trade has turned, and the reason for getting into the trade in the first place is no longer valid, is one of the biggest problems traders face. In this video, Ryan Mallory discusses the pitfalls that comes with refusing to take the loss and instead opting to become a bagholder on one's trades.
Be sure to check out my Swing-Trading offering through SharePlanner that goes hand-in-hand with my podcast, offering all of the research, charts and technical analysis on the stock market and individual stocks, not to mention my personal watch-lists, reviews and regular updates on the most popular stocks, including the all-important big tech stocks. Check it out now at: https://www.shareplanner.com/premium-plans
📈 START SWING-TRADING WITH ME! 📈
Click here to subscribe: https://shareplanner.com/tradingblock
— — — — — — — — —
💻 STOCK MARKET TRAINING COURSES 💻
Click here for all of my training courses: https://www.shareplanner.com/trading-academy
– The A-Z of the Self-Made Trader –https://www.shareplanner.com/the-a-z-of-the-self-made-trader
– The Winning Watch-List — https://www.shareplanner.com/winning-watchlist
– Patterns to Profits — https://www.shareplanner.com/patterns-to-profits
– Get 1-on-1 Coaching — https://www.shareplanner.com/coaching
— — — — — — — — —
❤️ SUBSCRIBE TO MY YOUTUBE CHANNEL 📺
Click here to subscribe: https://www.youtube.com/shareplanner?sub_confirmation=1
🎧 LISTEN TO MY PODCAST 🎵
Click here to listen to my podcast: https://open.spotify.com/show/5Nn7MhTB9HJSyQ0C6bMKXI
— — — — — — — — —
💰 FREE RESOURCES 💰
— — — — — — — — —
🛠 TOOLS OF THE TRADE 🛠
Software I use (TC2000): https://bit.ly/2HBdnBm
— — — — — — — — —
📱 FOLLOW SHAREPLANNER ON SOCIAL MEDIA 📱
FACEBOOK: https://facebook.com/shareplanner
*Disclaimer: Ryan Mallory is not a financial adviser and this podcast is for entertainment purposes only. Consult your financial adviser before making any decisions.

You Might Like

South Korea: The Hidden Driver of US Tech Volatility

Stop Trying to Hit Home Runs: Start Trading Within Your Means

How to Trade Breakouts Without Getting Trapped