
Technical Outlook:
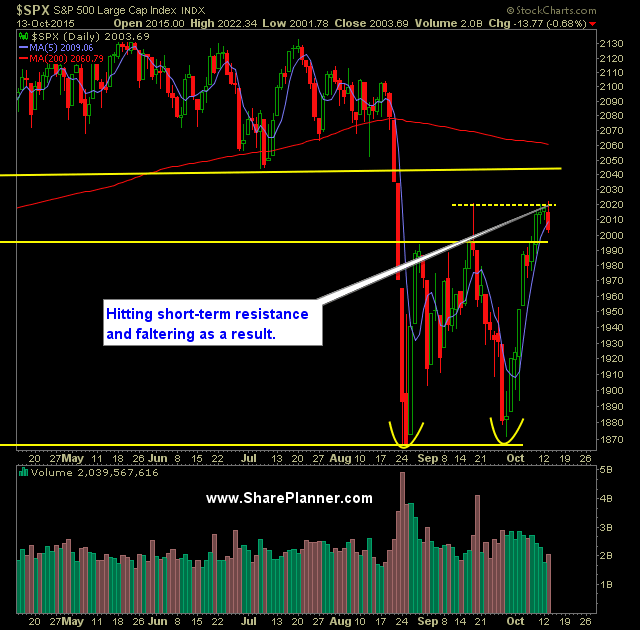
- SPX is faltering as it struggles to break through and close above the highs of 9/17 of 2020.
- 3-day range on the 30-minute SPX chart was broken yesterday on a move below 2006.
- Yesterday represented the biggest sell-off since the entire rally started on 9/29.
- Yesterday was a minor sell-off and doesn’t mean the rally is over. However, it is important to wait and see whether the rally has a desire to continue at this point.
- SPY volume saw a noticeable pick up in volume from the day before, however, overall it was almost half of what the average volume has been of late.
- The low-volume sell-off on the SPY suggests that this pullback we saw yesterday is being conducted in an orderly manner with no real signs of panic.
- VIX ended its record-tying losing streak of 10 consecutive days, by rallying 9.3% to close at 17.67.
- Ultimately, I wouldn’t be surprised if the current rally in equities continues until VIX goes sub-11 again.
- Despite the decline yesterday, T2108 (% of stocks trading above the 40-day moving average) doesn’t show any level of panic or concern at this moment with it only declining 8% to 60%.
- Most concerning event to me yesterday was the fact that SPX closed below the 5-day moving average. This MA has offered a great deal of support throughout the current rally. Bulls will need to recapture this MA rather quickly.
- 2059 is the break-even level for the market on the year. It also happens to be where the 200-day moving average is sitting at.
- The Fed has never raised interest rates at a point where the market was trading lower on the year.
My Trades:
- Sold EL yesterday at $83.04 for a 3.1% gain.
- Did not add any new swing-trades to the portfolio yesterday.
- 30% Long / 70% Cash
- Remain long: SBUX at $58.67, DIS at $105.88, GOOGL at $676.40
- My focus in trading remains to trade to the long side.
- Join me each day for all my real-time trades and alerts in the SharePlanner Splash Zone
Chart for SPX:


Welcome to Swing Trading the Stock Market Podcast!
I want you to become a better trader, and you know what? You absolutely can!
Commit these three rules to memory and to your trading:
#1: Manage the RISK ALWAYS!
#2: Keep the Losses Small
#3: Do #1 & #2 and the profits will take care of themselves.
That’s right, successful swing-trading is about managing the risk, and with Swing Trading the Stock Market podcast, I encourage you to email me (ryan@shareplanner.com) your questions, and there’s a good chance I’ll make a future podcast out of your stock market related question.
Watching the dollars rise and fall in your trading account can turn a well-planned swing trade into an emotional, deeply personal decision. In this episode, I explain why focusing on price action, percentage returns, and R-multiples can help you avoid cutting winners early, holding losers too long, and abandoning your trading plan.
Be sure to check out my Swing-Trading offering through SharePlanner that goes hand-in-hand with my podcast, offering all of the research, charts and technical analysis on the stock market and individual stocks, not to mention my personal watch-lists, reviews and regular updates on the most popular stocks, including the all-important big tech stocks. Check it out now at: https://www.shareplanner.com/premium-plans
📈 START SWING-TRADING WITH ME! 📈
Click here to subscribe: https://shareplanner.com/tradingblock
— — — — — — — — —
💻 STOCK MARKET TRAINING COURSES 💻
Click here for all of my training courses: https://www.shareplanner.com/trading-academy
– The A-Z of the Self-Made Trader –https://www.shareplanner.com/the-a-z-of-the-self-made-trader
– The Winning Watch-List — https://www.shareplanner.com/winning-watchlist
– Patterns to Profits — https://www.shareplanner.com/patterns-to-profits
– Get 1-on-1 Coaching — https://www.shareplanner.com/coaching
— — — — — — — — —
❤️ SUBSCRIBE TO MY YOUTUBE CHANNEL 📺
Click here to subscribe: https://www.youtube.com/shareplanner?sub_confirmation=1
🎧 LISTEN TO MY PODCAST 🎵
Click here to listen to my podcast: https://open.spotify.com/show/5Nn7MhTB9HJSyQ0C6bMKXI
— — — — — — — — —
💰 FREE RESOURCES 💰
— — — — — — — — —
🛠 TOOLS OF THE TRADE 🛠
Software I use (TC2000): https://bit.ly/2HBdnBm
— — — — — — — — —
📱 FOLLOW SHAREPLANNER ON SOCIAL MEDIA 📱
*Disclaimer: Ryan Mallory is not a financial adviser and this podcast is for entertainment purposes only. Consult your financial adviser before making any decisions.

You Might Like

South Korea: The Hidden Driver of US Tech Volatility

Stop Trying to Hit Home Runs: Start Trading Within Your Means

How to Trade Breakouts Without Getting Trapped