
Technical Outlook:
- Strong move yesterday that faded late into the close. The problem with that, is a lot of rallies have gone on to die, the closer it gets to new all-time highs.

- As a result, I curbed some of my long exposure. Willing to add it back today, but also balancing that act with a strong since of caution until this market can push through new all-time highs.
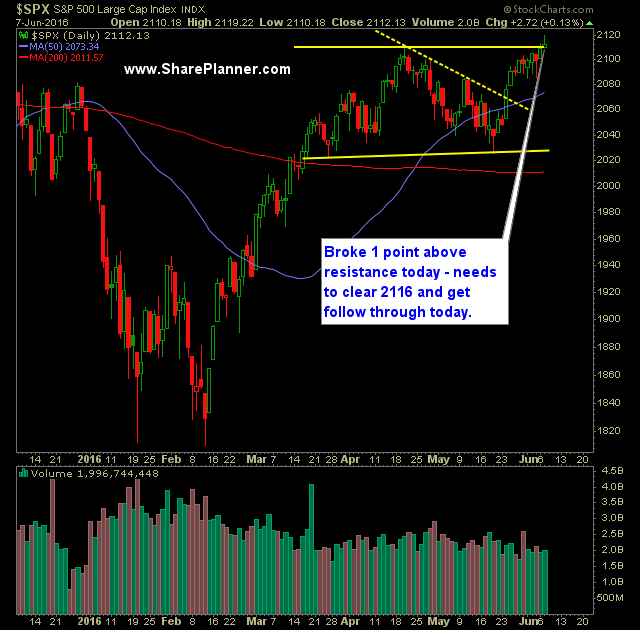
- Key resistance at 2111 was broken, and price closed at 2112, thereby establishing new rally highs off of the February lows, and also confirming one of the most unusual inverse head and shoulders patterns you’ve ever seen.
- SPY volume fell yet again – well below recent averages, and one of the lowest volume readings of the year.
- SPX really needs follow through to the upside and thereby breaking through 2116 to the upside, to clear the November 2015 highs. By doing so, it would confirm yesterday’s measly move.
- 30 minute chart of SPX suggests that a pullback to the range of 2104 to 2110 is possible if the market decides to give back some today, when considering the uptrend off of the 5/19 lows.
- The move in VIX yesterday should be considered somewhat disturbing. There was a very hard bounce when the index dipped temporarily below the 13 support level. The rally that ensued was eye-catching.
- VIX is right at the support level where massive volatility rallies occur, SPX is right at the upper range of where its rallies go to die. I’m not calling a top here, but caution should be taken.
- T2108 (% of stocks trading above their 40-day moving average) rose 3.5% to 73% yesterday. A bearish divergence from the highs that were achieved in March/April.
- A strong move above 2116 would take the S&P 500 above the right shoulder of the two year long head and shoulders pattern, and technically nullifying the pattern.
- There are scenarios at play here that can change the market for the better, and they are just a short distance away.
- At some point this month, the brexit vote will become a concern for the market. So far, the market is ignoring its implications.
- For the bears, the objective is simply to sustain a hard sell-off and to not give back those losses by the close.
- The short-term head and shoulders pattern that we had been following last month has been nullified, but in the same time frame going back to April, you could make the case that a possible double top is forming if price begins to accelerate to the downside.
- I believe, at this point, profits have to be taken aggressively, and avoid the tendency to let the profits run – the market is in a very choppy range that has mired stock price for the past two years. Unless it breaks out of it and onto new all-time highs, then taking profits aggressively is absolutely important.
My Trades:
- Sold UPRO yesterday at $68.45 for a 3.0% profit.
- Sold ADBE yesterday at 98.79 for a -0.9% loss.
- Added two new trades to the portfolio yesterday.
- Currently 20% Long / 80% Cash
- Will look to possibly add 1-2 new positions today if the market can continue pushing higher.
- Join me each day for all my real-time trades and alerts in the SharePlanner Splash Zone
Chart for SPX:


Welcome to Swing Trading the Stock Market Podcast!
I want you to become a better trader, and you know what? You absolutely can!
Commit these three rules to memory and to your trading:
#1: Manage the RISK ALWAYS!
#2: Keep the Losses Small
#3: Do #1 & #2 and the profits will take care of themselves.
That’s right, successful swing-trading is about managing the risk, and with Swing Trading the Stock Market podcast, I encourage you to email me (ryan@shareplanner.com) your questions, and there’s a good chance I’ll make a future podcast out of your stock market related question.
Watching the dollars rise and fall in your trading account can turn a well-planned swing trade into an emotional, deeply personal decision. In this episode, I explain why focusing on price action, percentage returns, and R-multiples can help you avoid cutting winners early, holding losers too long, and abandoning your trading plan.
Be sure to check out my Swing-Trading offering through SharePlanner that goes hand-in-hand with my podcast, offering all of the research, charts and technical analysis on the stock market and individual stocks, not to mention my personal watch-lists, reviews and regular updates on the most popular stocks, including the all-important big tech stocks. Check it out now at: https://www.shareplanner.com/premium-plans
📈 START SWING-TRADING WITH ME! 📈
Click here to subscribe: https://shareplanner.com/tradingblock
— — — — — — — — —
💻 STOCK MARKET TRAINING COURSES 💻
Click here for all of my training courses: https://www.shareplanner.com/trading-academy
– The A-Z of the Self-Made Trader –https://www.shareplanner.com/the-a-z-of-the-self-made-trader
– The Winning Watch-List — https://www.shareplanner.com/winning-watchlist
– Patterns to Profits — https://www.shareplanner.com/patterns-to-profits
– Get 1-on-1 Coaching — https://www.shareplanner.com/coaching
— — — — — — — — —
❤️ SUBSCRIBE TO MY YOUTUBE CHANNEL 📺
Click here to subscribe: https://www.youtube.com/shareplanner?sub_confirmation=1
🎧 LISTEN TO MY PODCAST 🎵
Click here to listen to my podcast: https://open.spotify.com/show/5Nn7MhTB9HJSyQ0C6bMKXI
— — — — — — — — —
💰 FREE RESOURCES 💰
— — — — — — — — —
🛠 TOOLS OF THE TRADE 🛠
Software I use (TC2000): https://bit.ly/2HBdnBm
— — — — — — — — —
📱 FOLLOW SHAREPLANNER ON SOCIAL MEDIA 📱
*Disclaimer: Ryan Mallory is not a financial adviser and this podcast is for entertainment purposes only. Consult your financial adviser before making any decisions.

You Might Like

South Korea: The Hidden Driver of US Tech Volatility

Stop Trying to Hit Home Runs: Start Trading Within Your Means

How to Trade Breakouts Without Getting Trapped