
Technical Outlook:
- SPX managed to rally a small amount off of the FOMC Statement from yesterday. However, towards the final hour of trading, some profit taking emerged.
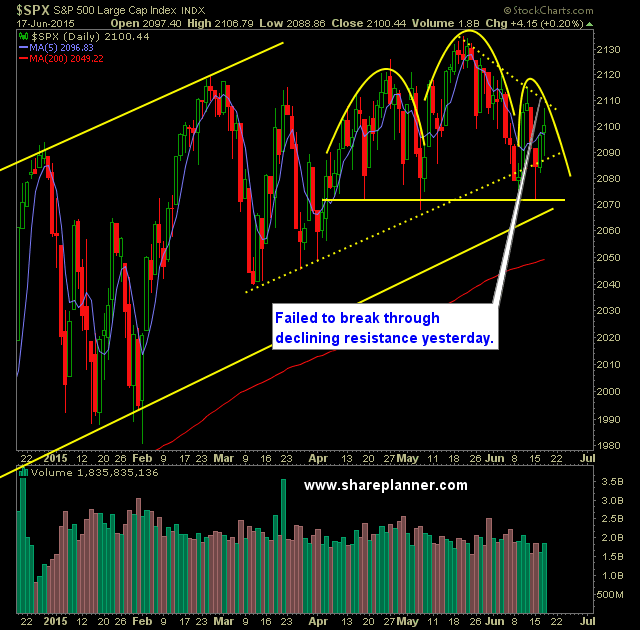
- Declining resistance off of the May highs held up yesterday upon being tested. Today, resistance is at 2105.
- SPY closed by forming a massive doji candle on the day and right on top of its 50-day moving average.
- Speaking of moving average, the 20-SMA has provided a consistent level of resistance for traders over the course of the past month.
- SPY volume was strong yesterday which wasn’t unexpected considering it was Fed Day.
- VIX continued its sell-off and struggling with resistance in the 15.60’s.
- Double bottom formed SPX 30 minute chart but not yet confirmed. Instead it is the aforementioned declining resistance.
- For the bulls to regain control of this market, it ultimately needs to establish new all-time highs yet again.
- It is amazing how difficult of a time the market has in mounting any significant selling pressures against this market. The last wave happened in September/October of last year, and despite hardly any growth this year, the market is giving up very little ground to the downside, which obviously creates a massive stalemate.
- 2072 on SPX remains the key for the bears going forward. Break that, and you have a confirmed head and shoulders pattern on the daily chart.
- Greece continues to dominate the headlines and still the major mover of the market. Nothing is getting resolved but usually politicians find a short-term fix so they can insure their own re-election. No matter how ill-advised the agreement might be.
- The market doesn’t care about the economy nor earnings. That is not what is driving it. The market only cares about what the Fed is doing to keep equities propped up.
My Trades:
- Closed out UPRO at 69.40 for a 0.8% gain.
- Did not add any new positions yesterday.
- 10% short / 90% cash.
- Remain short XYL at 36.16.
- I’ll consider adding 1-2 new short position to the portfolio today, if price fails to break through the declining resistance off of the May highs.
- Join me each day for all my real-time trades and alerts in the SharePlanner Splash Zone
Chart for SPX:


Welcome to Swing Trading the Stock Market Podcast!
I want you to become a better trader, and you know what? You absolutely can!
Commit these three rules to memory and to your trading:
#1: Manage the RISK ALWAYS!
#2: Keep the Losses Small
#3: Do #1 & #2 and the profits will take care of themselves.
That’s right, successful swing-trading is about managing the risk, and with Swing Trading the Stock Market podcast, I encourage you to email me (ryan@shareplanner.com) your questions, and there’s a good chance I’ll make a future podcast out of your stock market related question.
Watching the dollars rise and fall in your trading account can turn a well-planned swing trade into an emotional, deeply personal decision. In this episode, I explain why focusing on price action, percentage returns, and R-multiples can help you avoid cutting winners early, holding losers too long, and abandoning your trading plan.
Be sure to check out my Swing-Trading offering through SharePlanner that goes hand-in-hand with my podcast, offering all of the research, charts and technical analysis on the stock market and individual stocks, not to mention my personal watch-lists, reviews and regular updates on the most popular stocks, including the all-important big tech stocks. Check it out now at: https://www.shareplanner.com/premium-plans
📈 START SWING-TRADING WITH ME! 📈
Click here to subscribe: https://shareplanner.com/tradingblock
— — — — — — — — —
💻 STOCK MARKET TRAINING COURSES 💻
Click here for all of my training courses: https://www.shareplanner.com/trading-academy
– The A-Z of the Self-Made Trader –https://www.shareplanner.com/the-a-z-of-the-self-made-trader
– The Winning Watch-List — https://www.shareplanner.com/winning-watchlist
– Patterns to Profits — https://www.shareplanner.com/patterns-to-profits
– Get 1-on-1 Coaching — https://www.shareplanner.com/coaching
— — — — — — — — —
❤️ SUBSCRIBE TO MY YOUTUBE CHANNEL 📺
Click here to subscribe: https://www.youtube.com/shareplanner?sub_confirmation=1
🎧 LISTEN TO MY PODCAST 🎵
Click here to listen to my podcast: https://open.spotify.com/show/5Nn7MhTB9HJSyQ0C6bMKXI
— — — — — — — — —
💰 FREE RESOURCES 💰
— — — — — — — — —
🛠 TOOLS OF THE TRADE 🛠
Software I use (TC2000): https://bit.ly/2HBdnBm
— — — — — — — — —
📱 FOLLOW SHAREPLANNER ON SOCIAL MEDIA 📱
*Disclaimer: Ryan Mallory is not a financial adviser and this podcast is for entertainment purposes only. Consult your financial adviser before making any decisions.

You Might Like

South Korea: The Hidden Driver of US Tech Volatility

Stop Trying to Hit Home Runs: Start Trading Within Your Means

How to Trade Breakouts Without Getting Trapped