
Pre-market update (updated 8am eastern):
- European markets are trading -1.8% lower.
- Asian markets traded -1.8% lower.
- US futures are trading slightly lower ahead of the opening bell.
Economic reports due out (all times are eastern): Consumer Price Index (8:30am), Jobless Claims (8:30am), PMI Manufacturing Index Flash (8:58am), Existing Home Sales (10am), Philadelphia Fed Survey (10am), Leading INdicators (10am), EIA Natural Gas Report (10:30am), EIA Petroleum Status Report (11am)
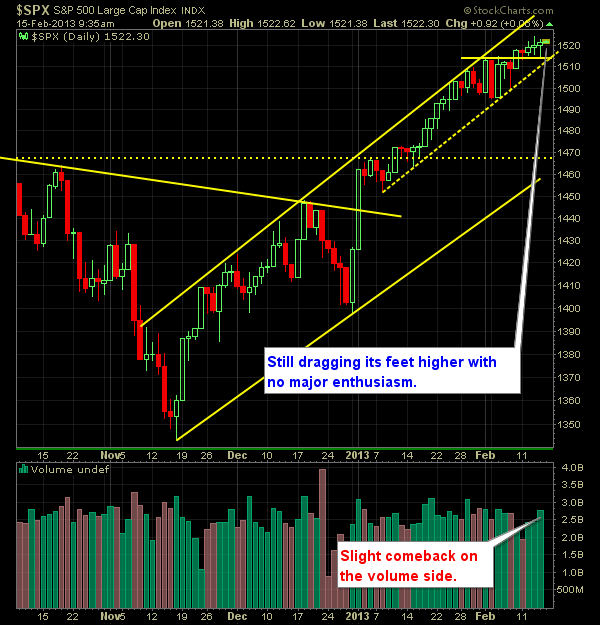
Technical Outlook (SPX):
- Heavy, heavy sell-off yesterday that pushed us right through the 10-day moving average.
- 20-day moving average is set to be tested at 1510. This will be the first legitimate test of the 20-dma this year.
- Another sell-off today that takes us below support at 1495 (16 points away) would likely lead us to testing the lower, rising channel (see below) at 1475.
- The last time we experienced a heavy sell-off in the markets it was met with an equal bounce the following day.
- Volume was above average and supported the overall market move in regards to the intensity of it.
- The VIX popped up nearly 20% yesterday from the low 12’s up to the mid-14’s, showing that volatility is starting to creep back into this market.
- 30-minute chart of SPX shows an index breaking below major support levels in the short-term.
- Much of the rally, outside of the initial burst on 12/31 & 1/2 has been marked by a drift higher rather than rampant surges and large gaps higher.
- A break of 1495 is absolutely key in this market to get the bears motivated.
- A pullback to 1475 would likely satisfy as a pullback to the lower rising channel, and be considered healthy for this market.
- We haven’t seen a market pullback in excess of 4% since October/November time-frame.
- There’s not much in the way overhead resistance that will keep this market from hitting all-time highs from a technical analysis standpoint.
- The channel that we are currently trading in looks very similar to the channel that we traded in last year from June through September.
My Opinions & Trades:
- Closed out EXP yesterday at $65.50 for a -2% loss.
- Closed out POL yesterday at $22.49 for a -2.9% loss.
- No new trades yesterday.
- Remain Long HCBK at $8.73, ADBE at $38.88 and MTB at $105.73..
- Here is my real-time swing-trading portfolio and past-performance
Chart for SPX:


Welcome to Swing Trading the Stock Market Podcast!
I want you to become a better trader, and you know what? You absolutely can!
Commit these three rules to memory and to your trading:
#1: Manage the RISK ALWAYS!
#2: Keep the Losses Small
#3: Do #1 & #2 and the profits will take care of themselves.
That’s right, successful swing-trading is about managing the risk, and with Swing Trading the Stock Market podcast, I encourage you to email me (ryan@shareplanner.com) your questions, and there’s a good chance I’ll make a future podcast out of your stock market related question.
Watching the dollars rise and fall in your trading account can turn a well-planned swing trade into an emotional, deeply personal decision. In this episode, I explain why focusing on price action, percentage returns, and R-multiples can help you avoid cutting winners early, holding losers too long, and abandoning your trading plan.
Be sure to check out my Swing-Trading offering through SharePlanner that goes hand-in-hand with my podcast, offering all of the research, charts and technical analysis on the stock market and individual stocks, not to mention my personal watch-lists, reviews and regular updates on the most popular stocks, including the all-important big tech stocks. Check it out now at: https://www.shareplanner.com/premium-plans
📈 START SWING-TRADING WITH ME! 📈
Click here to subscribe: https://shareplanner.com/tradingblock
— — — — — — — — —
💻 STOCK MARKET TRAINING COURSES 💻
Click here for all of my training courses: https://www.shareplanner.com/trading-academy
– The A-Z of the Self-Made Trader –https://www.shareplanner.com/the-a-z-of-the-self-made-trader
– The Winning Watch-List — https://www.shareplanner.com/winning-watchlist
– Patterns to Profits — https://www.shareplanner.com/patterns-to-profits
– Get 1-on-1 Coaching — https://www.shareplanner.com/coaching
— — — — — — — — —
❤️ SUBSCRIBE TO MY YOUTUBE CHANNEL 📺
Click here to subscribe: https://www.youtube.com/shareplanner?sub_confirmation=1
🎧 LISTEN TO MY PODCAST 🎵
Click here to listen to my podcast: https://open.spotify.com/show/5Nn7MhTB9HJSyQ0C6bMKXI
— — — — — — — — —
💰 FREE RESOURCES 💰
— — — — — — — — —
🛠 TOOLS OF THE TRADE 🛠
Software I use (TC2000): https://bit.ly/2HBdnBm
— — — — — — — — —
📱 FOLLOW SHAREPLANNER ON SOCIAL MEDIA 📱
*Disclaimer: Ryan Mallory is not a financial adviser and this podcast is for entertainment purposes only. Consult your financial adviser before making any decisions.

You Might Like

South Korea: The Hidden Driver of US Tech Volatility

Stop Trying to Hit Home Runs: Start Trading Within Your Means

How to Trade Breakouts Without Getting Trapped