

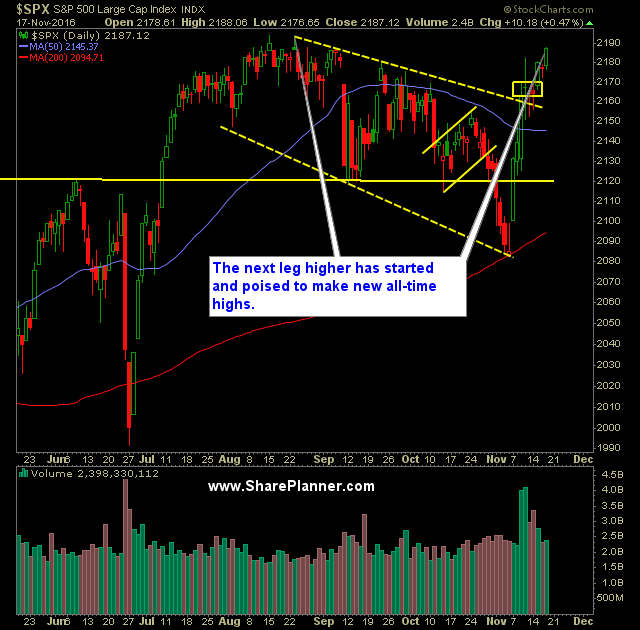
Technical Analysis:
- Strong move from the market yesterday, with the S&P 500 (SPX) rising another 0.5% and just six points away from new all-time highs.
- Currently SPX is underway on the second leg of the bounce that began last week. If it is anything like the Brexit bounce it should still have more room to run before finding some sellers.
- The 5-day moving average continues to offer a great deal of support for SPX.
- Volume on SPDRs S&P 500 (SPY) broke the five-day decline. Despite this, the volume was still below recent averages.
- Massive bearish engulfing candle pattern on United States Oil Fund (USO) and saw a rejection at the 20-day moving average. This puts the current bounce in oil at high-risk.
- CBOE Market Volatility Index (VIX) continues to hold the rising trend-line off of the August lows. Despite breaking it intraday yestrday, VIX managed to rally and close right on the trend-line.
- Nasdaq (QQQ) continues to exhibit the most strength of all the indices of the last three days.
- SPX 30 minute chart trending nicely after breaking out of the triangle from earlier this week. Solid higher highs and higher lows.
- Dow Jones Industrial (DJIA) coiling nicely over the last four days and still holding the 5-day moving average in the process.
My Trades:
- Sold MU yesterday at 19.22 for a 7.0% Profit.
- Added three new swing-trades to my portfolio yesterday.
- Will look to add 1-2 new swing-trades to my portfolio today.
- I am currently 40% Long / 10% Short / 50% Cash
Chart for SPX:


Welcome to Swing Trading the Stock Market Podcast!
I want you to become a better trader, and you know what? You absolutely can!
Commit these three rules to memory and to your trading:
#1: Manage the RISK ALWAYS!
#2: Keep the Losses Small
#3: Do #1 & #2 and the profits will take care of themselves.
That’s right, successful swing-trading is about managing the risk, and with Swing Trading the Stock Market podcast, I encourage you to email me (ryan@shareplanner.com) your questions, and there’s a good chance I’ll make a future podcast out of your stock market related question.
In this podcast episode, Ryan discusses how really bad, losing trades in the stock market creates an impossible scenario for the trader in terms of what the right decision should be.
Be sure to check out my Swing-Trading offering through SharePlanner that goes hand-in-hand with my podcast, offering all of the research, charts and technical analysis on the stock market and individual stocks, not to mention my personal watch-lists, reviews and regular updates on the most popular stocks, including the all-important big tech stocks. Check it out now at: https://www.shareplanner.com/premium-plans
📈 START SWING-TRADING WITH ME! 📈
Click here to subscribe: https://shareplanner.com/tradingblock
— — — — — — — — —
💻 STOCK MARKET TRAINING COURSES 💻
Click here for all of my training courses: https://www.shareplanner.com/trading-academy
– The A-Z of the Self-Made Trader –https://www.shareplanner.com/the-a-z-of-the-self-made-trader
– The Winning Watch-List — https://www.shareplanner.com/winning-watchlist
– Patterns to Profits — https://www.shareplanner.com/patterns-to-profits
– Get 1-on-1 Coaching — https://www.shareplanner.com/coaching
— — — — — — — — —
❤️ SUBSCRIBE TO MY YOUTUBE CHANNEL 📺
Click here to subscribe: https://www.youtube.com/shareplanner?sub_confirmation=1
🎧 LISTEN TO MY PODCAST 🎵
Click here to listen to my podcast: https://open.spotify.com/show/5Nn7MhTB9HJSyQ0C6bMKXI
— — — — — — — — —
💰 FREE RESOURCES 💰
— — — — — — — — —
🛠 TOOLS OF THE TRADE 🛠
Software I use (TC2000): https://bit.ly/2HBdnBm
— — — — — — — — —
📱 FOLLOW SHAREPLANNER ON SOCIAL MEDIA 📱
FACEBOOK: https://facebook.com/shareplanner
*Disclaimer: Ryan Mallory is not a financial adviser and this podcast is for entertainment purposes only. Consult your financial adviser before making any decisions.
You Might Like

South Korea: The Hidden Driver of US Tech Volatility

Stop Trying to Hit Home Runs: Start Trading Within Your Means

How to Trade Breakouts Without Getting Trapped