Bears so far has put in a lackluster effort of driving this market lower, but despite yesterday’s rally, still has the favor of all the daily charts on all the indices. If the afternoon can treat them kind and wipe out the gains from yesterday, and perhaps break the lows from last week, then there
I have to level with you all…I find this market rally extremely skeptical. It is another one of those market-hijacked rallies based off of a headline from left-field. Two weeks ago, oil jump started its rally when an oil community in Canada was set ablaze. Today it is the market rallying off news Warren Buffett

It is the best rally that the market has seen in over a month. But there is plenty to be concerned with here still. For one, SPX doesn’t seem to crazy about wanting to push through the 20-day moving average, but it hasn’t been rejected by it yet either. If a hard rejection happens
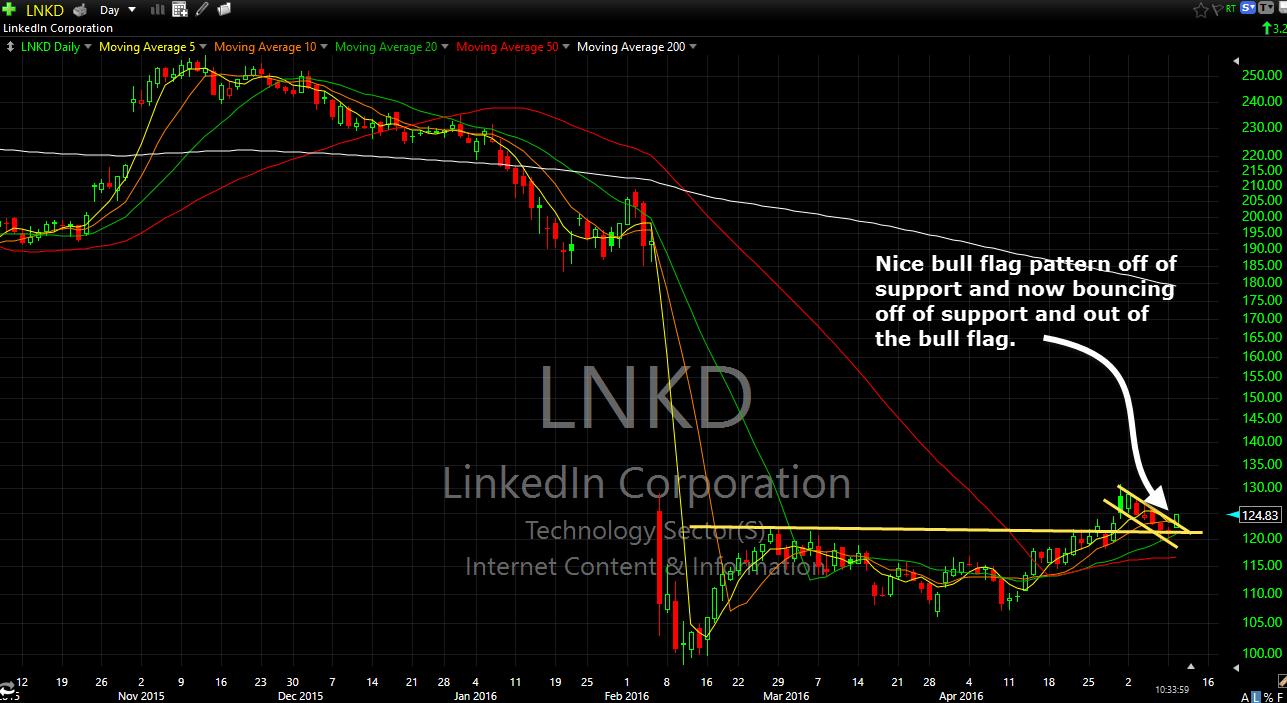
5/10: LNKD, following their horrific sell-off after their February earnings report, has created a very nice base that it is now attempting to break out of and push into the gap. It has pulled back from $130 over the five days with very light volume and is attempting to bounce higher off of support in
Stocks so far today have been up and down and not showing a clear sense of direction here. That may change going into the afternoon or in the days ahead. But I think for now, it has to be respected, the reversal in price action on Friday and where it took place at – on
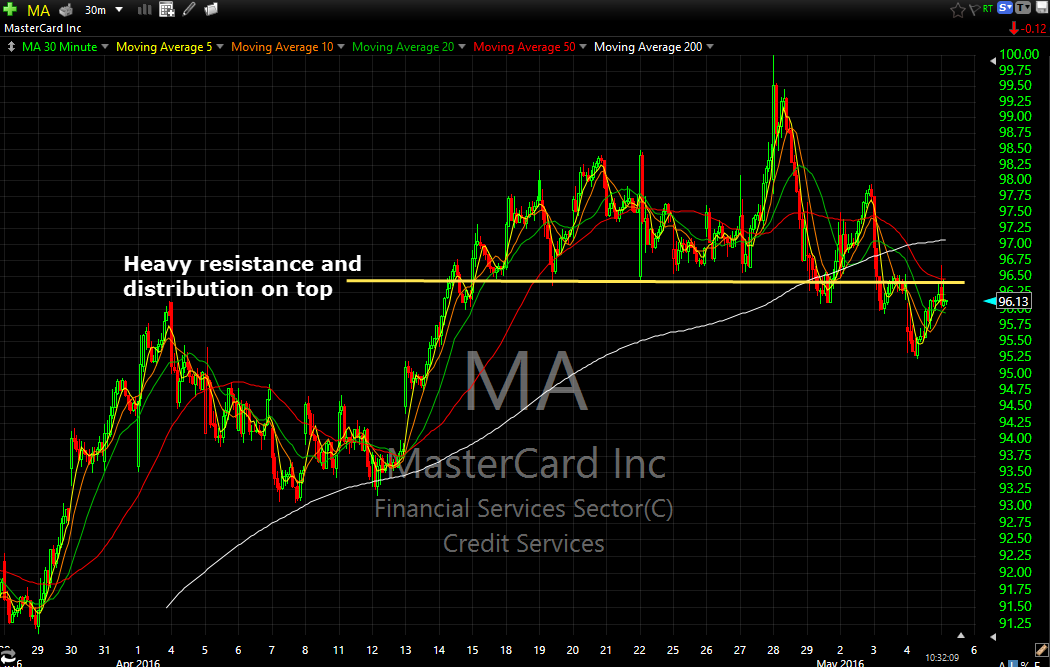
Heavy amounts of distribution for the better part of April and into May with the 20-day moving average providing substantial resistance overhead as well as an ugly weekly chart that seems to be hitting resistance again on the long-term time frame and on the 30 minute chart it shows more clearly the heavy distribution and

One of the members of the SharePlanner Splash Zone Today pointed out a nice trade setup in GIS and so I thought I’d dissect it for you and give some thoughts on it. Quite a nice trade setup really, with a readily definable risk/reward to it. Obviously, this isn’t a trade that is going to
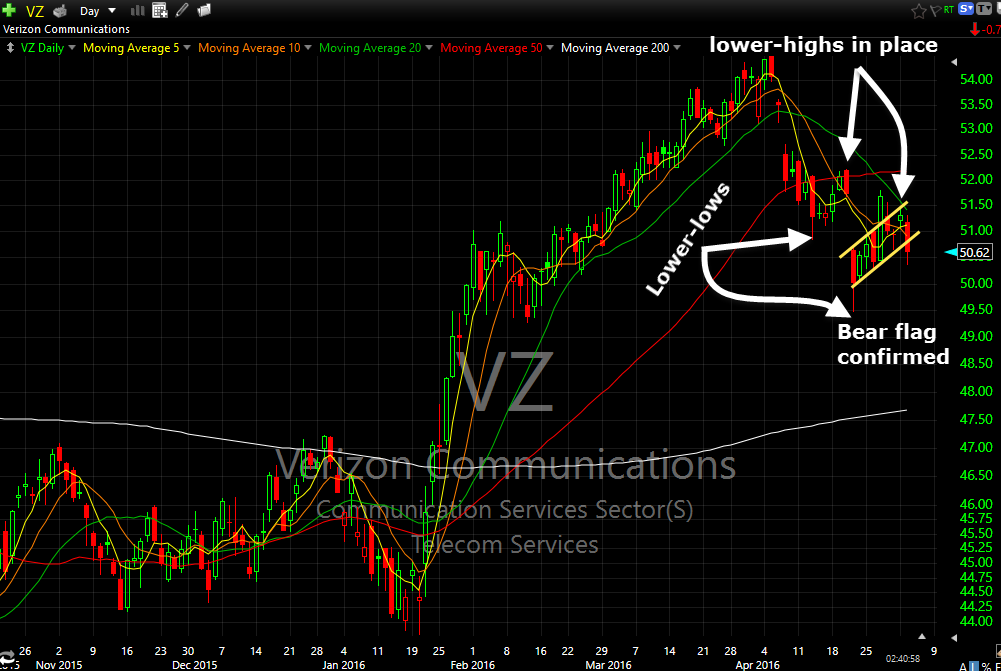
Bear flag on VZ that is confirming to the downside along with a nice series of lower-highs and lower-lows. 30 minute chart also suggests some resistance at the $51 area. On the weekly chart there is a massive double top pattern brewing.

The bulls should be getting worried here. Yes, they find a way to rally the market off of its steep lows every time we see a sell-off, and we are seeing that happen again today, but the theme is that the bears are being relatively persistent in the last few weeks by putting its boot

ORCL is sporting a perfect double top and and confirming the pattern today as well as breaking below the 50-day moving average. There is also a gap in the $38's that remains unfilled and continued weakness in this market would likely lead to that gap being filled.

spc@shareplanner.com
(904) 800-8420
© Copyright 2025 | SharePlanner Inc. All Rights Reserved.
Disclaimer: The information provided on this website is for educational and informational purposes only. Ryan Mallory and/or SharePlanner are not licensed financial advisors, brokers, or tax professionals. The content on this site should not be considered as financial, investment, tax, or legal advice.
All information and opinions expressed herein are based on sources believed to be accurate and reliable. However, we make no representation or warranty as to their accuracy, completeness, or reliability. Any action you take upon the information on this website is strictly at your own risk.
Past performance is not indicative of future results. Investing involves risk, including the possible loss of principal. All investors should make their own decisions based on their specific investment objectives and financial circumstances.
This site may contain links to external websites that are not provided or maintained by or in any way affiliated with Ryan Mallory and/or SharePlanner. Please note that Ryan Mallory and/or SharePlanner do not guarantee the accuracy, relevance, timeliness, or completeness of any information on these external websites.
By using this website, you agree that Ryan Mallory and/or SharePlanner and any affiliated parties are not responsible for any losses or damages resulting from your use of or reliance on the information provided.
It is strongly recommended that you consult with a qualified professional before making any financial decisions.