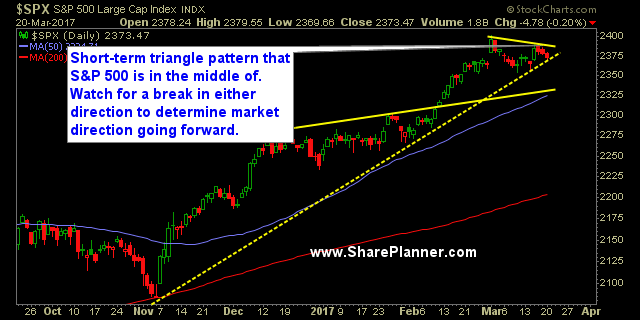
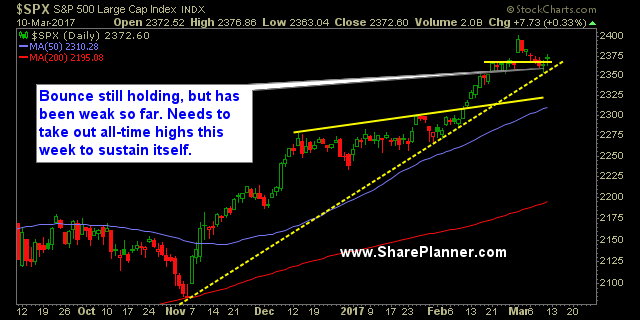
Short-term triangle pattern on SPX SPX has been coiling in a triangle pattern the past three weeks now, or essentially, this entire month of trading. It has pulled back to the rising trend-line that forms the bottom half of the triangle pattern. However, it has only experienced a mild, light volume pullback over the past

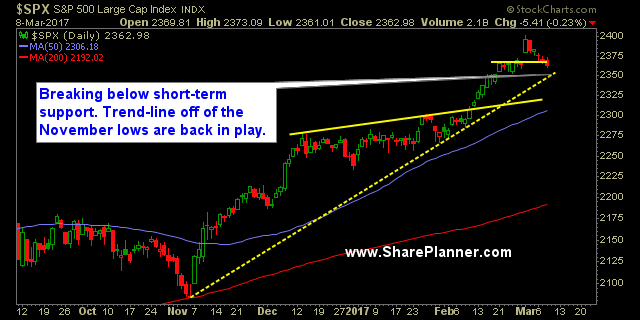
Watch the trend-line on the chart of the S&P 500 A lot can change here today or this week if the rising trend-line as noted in the chart of the S&P 500 below fails to hold. You have a potential topping pattern – emphasis on “potential” – with a new all time high that was
The Fed Up Rally Takes Price Back to Almost All-Time Highs Of couse I am using a play on words as this Fed Up Trump Rally is hated and despised by most and defies the logic of investing in general. I mean, c'mon it has been since last October - almost a half of a
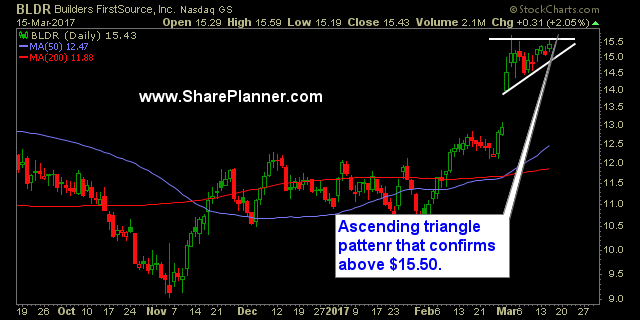
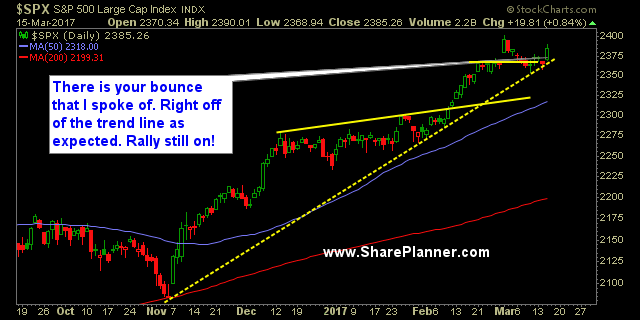
Breakout trading opportunities to watch for: Yesterday we talked about a form of breakouts that discovered and used by Nicolas Darvas Box trading that you can check out right here. This time around I want to highlight further the different forms of breakout trading. The S&P 500 bounced hard today and it is going to

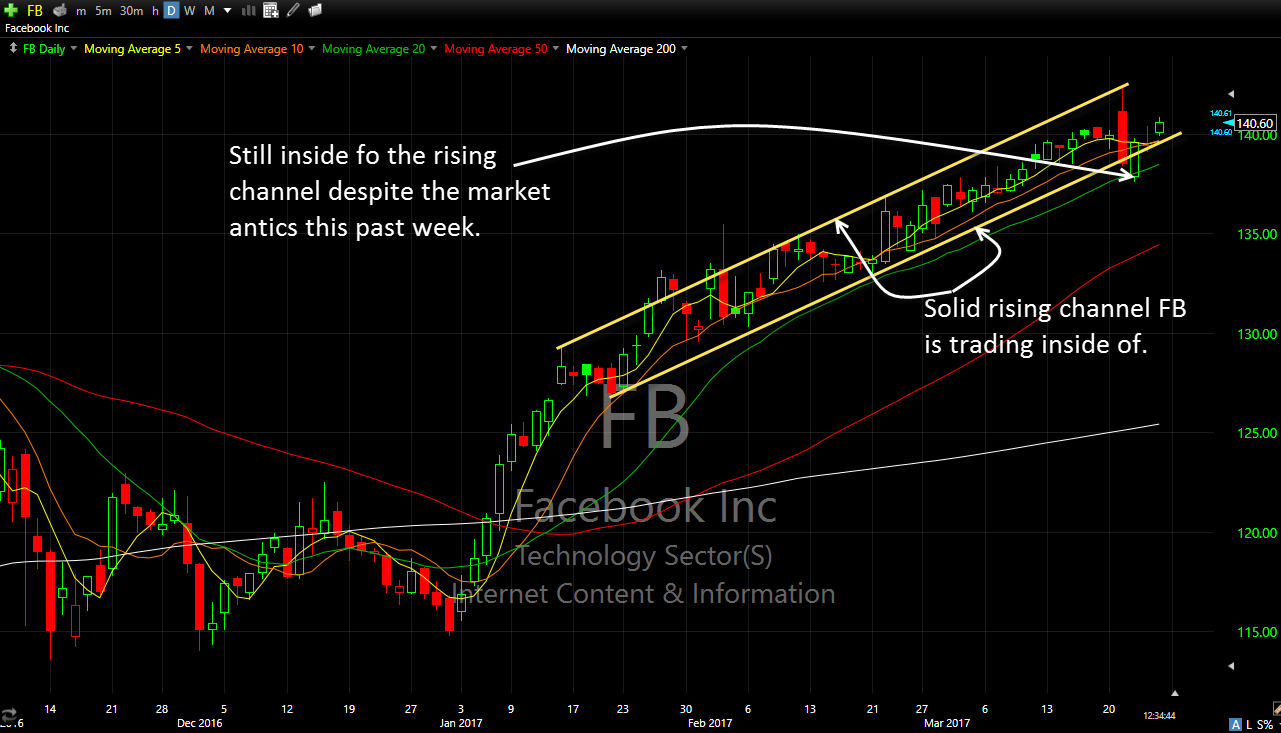
Technical Analysis of the S&P 500's current stock trend remains in tact That doesn't necessarily mean that all the stocks out there are holding it together because most of them are not. But the large caps, the ones that really drive the market's direction, like Apple (AAPL) for instance, is still holding it together and

Stock TA Diverging Hard from Market Price Action The price action is dull in the overall market, and while the price on the indices still hovers at the all-time highs, the TA of stocks (technical analysis) continues to falter under the surface. Breadth is dismal, and without a catalyst to continue pushing the market higher
A lethargic S&P 500 Index Chart The S&P 500 Index chart (SPX) is holding true to the rising trend-line and is holding the 20-day moving average as well. The FOMC is also upon us. This is the week that they are likely to raise rates, and if you remember, I've been saying for a couple of
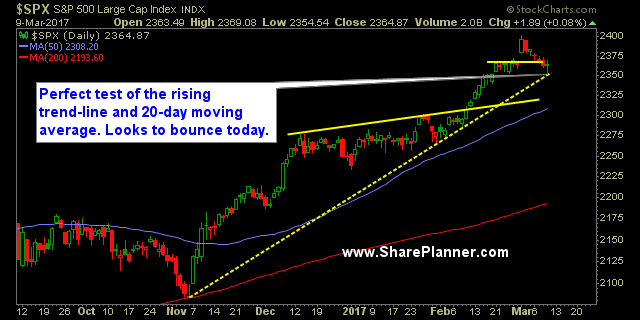
Trading Journal Notes Talked yesterday about the 20-day moving average being in play for the bulls and that is exactly what happened. Practically as perfect of a test as you could possibly have on a moving average, we then saw a hard and fast bounce into the close. I bought UPRO off of the MA
Trading the 3:30 Ramp Okay so the headline might be a bit of an exaggeration but the past two trading days, when 3:30pm eastern typically triggers an end of day run, the exact opposite has happened where stocks start to slide out of absolutely nowhere. Perhaps it is just a temporary thing, but one can’t

spc@shareplanner.com
(904) 800-8420
© Copyright 2025 | SharePlanner Inc. All Rights Reserved.
Disclaimer: The information provided on this website is for educational and informational purposes only. Ryan Mallory and/or SharePlanner are not licensed financial advisors, brokers, or tax professionals. The content on this site should not be considered as financial, investment, tax, or legal advice.
All information and opinions expressed herein are based on sources believed to be accurate and reliable. However, we make no representation or warranty as to their accuracy, completeness, or reliability. Any action you take upon the information on this website is strictly at your own risk.
Past performance is not indicative of future results. Investing involves risk, including the possible loss of principal. All investors should make their own decisions based on their specific investment objectives and financial circumstances.
This site may contain links to external websites that are not provided or maintained by or in any way affiliated with Ryan Mallory and/or SharePlanner. Please note that Ryan Mallory and/or SharePlanner do not guarantee the accuracy, relevance, timeliness, or completeness of any information on these external websites.
By using this website, you agree that Ryan Mallory and/or SharePlanner and any affiliated parties are not responsible for any losses or damages resulting from your use of or reliance on the information provided.
It is strongly recommended that you consult with a qualified professional before making any financial decisions.