Every swing trader knows the feeling. It is right before the opening bell, coffee in hand, when you check your portfolio and see one of your positions has gapped up. It is an adrenaline rush. But there is also the flip side, that sinking feeling when a stock gaps down against you, wiping out weeks
You have probably been there before. You see a stock breaking out above a key resistance level, and the price action looks incredibly bullish. The candles are green, momentum feels unstoppable, and fear of missing out starts creeping in. You hit the buy button, confident you’ve caught the beginning of a major move. Then almost
The AES Trade Setup The utility sector is often seen as a boring place for swing traders to park their cash. You usually don’t get the massive intraday swings or the hype that comes with big tech or AI stocks. But boredom can be a good thing when you are looking for consistency and clean
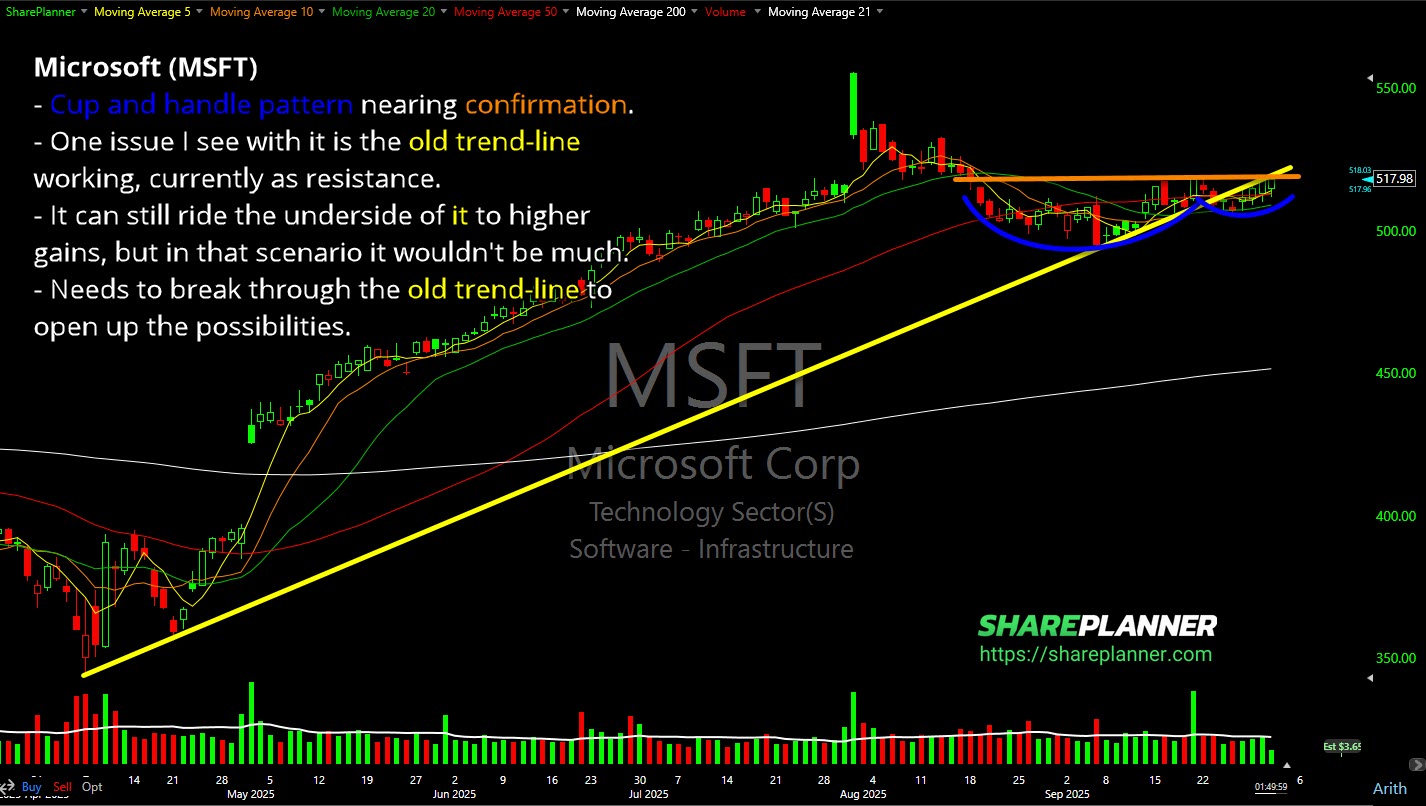
One thing I don't like about this cup and handle pattern on Microsoft (MSFT) is the resistance overhead from an old trend-line.

Backblaze (BLZE) breaking out of an ascending triangle today.

Broken trend lines creates resistance Something you want to watch for is the resistance that forms when a stock breaks below its trend-line. For most traders, once a trend line is broken, the trader simply dismisses the trend-line and forgets it never existed. However to the contrary, broken trend-lines creates a new layer of resistance.

Tesla (TSLA) breaking out of the continuation triangle on robotaxi news.

What was once broken resistance is now acting as support on SPY.

HIMS Update & Chart Analysis Hims & Hers (HIMS) surged over 23% after announcing a partnership with Novo Nordisk (NVO) to offer the weight-loss drug Wegovy through its telehealth platform. In this video, I analyze the breakout of the stock and explore what this means for HIMS stock moving forward. Become part of

QQQ Update & Chart Analysis The NASDAQ 100 (QQQ), has shown a notable rebound recently. In this video, I analyze the current technical indicators for the Nasdaq 100, key support and resistance levels, and discuss whether this tech rally is sustainable or a potential trap. Can this bounce continue? Become part of the

spc@shareplanner.com
(904) 800-8420
© Copyright 2025 | SharePlanner Inc. All Rights Reserved.
Disclaimer: The information provided on this website is for educational and informational purposes only. Ryan Mallory and/or SharePlanner are not licensed financial advisors, brokers, or tax professionals. The content on this site should not be considered as financial, investment, tax, or legal advice.
All information and opinions expressed herein are based on sources believed to be accurate and reliable. However, we make no representation or warranty as to their accuracy, completeness, or reliability. Any action you take upon the information on this website is strictly at your own risk.
Past performance is not indicative of future results. Investing involves risk, including the possible loss of principal. All investors should make their own decisions based on their specific investment objectives and financial circumstances.
This site may contain links to external websites that are not provided or maintained by or in any way affiliated with Ryan Mallory and/or SharePlanner. Please note that Ryan Mallory and/or SharePlanner do not guarantee the accuracy, relevance, timeliness, or completeness of any information on these external websites.
By using this website, you agree that Ryan Mallory and/or SharePlanner and any affiliated parties are not responsible for any losses or damages resulting from your use of or reliance on the information provided.
It is strongly recommended that you consult with a qualified professional before making any financial decisions.