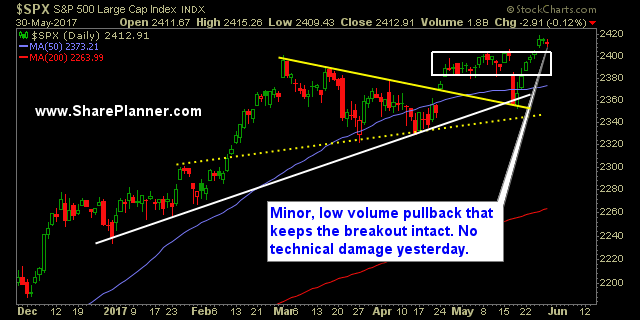
Instead of “Sell in May”, it is “Snooze in May” But more to the extent that the market is simply lacking the participants for big moves. There has only been one move so far this month that was in excess of 1%. But really, this market has been extremely flat since March. Nonetheless though, we
One last thought about bitcoin Okay, I want to go this whole week without mentioning bitcoin, crap I just mentioned it and even titled this post after it, so lets go ahead and throw that idea out the window, because it was over before it ever got started.
New All-Time Highs – Everything is fine…or should I worry? It is like the market is a sling-shot. Last Wednesday’s sell-off represents the moment where the sling gets pulled back, really hard, and the subsequent six days of buying in the market represents the market ‘letting go of the drawn sling and watching it propel
Bitcoins grow on trees Stocks rise for a fifth straight day. For sure though, the talk of the town is the metaphoric rise in crypto-currencies, i.e. Bitcoin. I’m literally sitting in a coffee shop yesterday going through my charts, and a random stranger starts asking me what I think about bitcoin. I tell him to
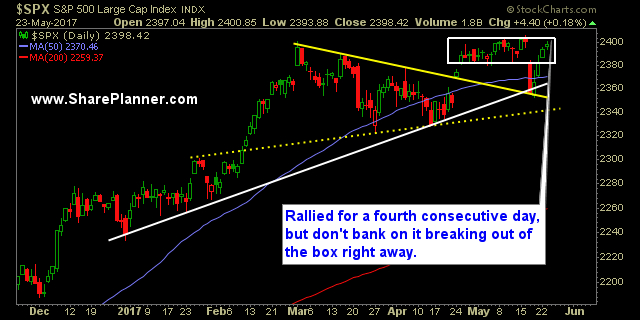
Back to the Dull Market Action Just as I was expecting, we are back to the market conditions that we saw prior to last Wednesday’s sell-off. The market has bounced hard off of those Wednesday’s lows and within four trading sessions, we are back inside of the box that price action has spent practically
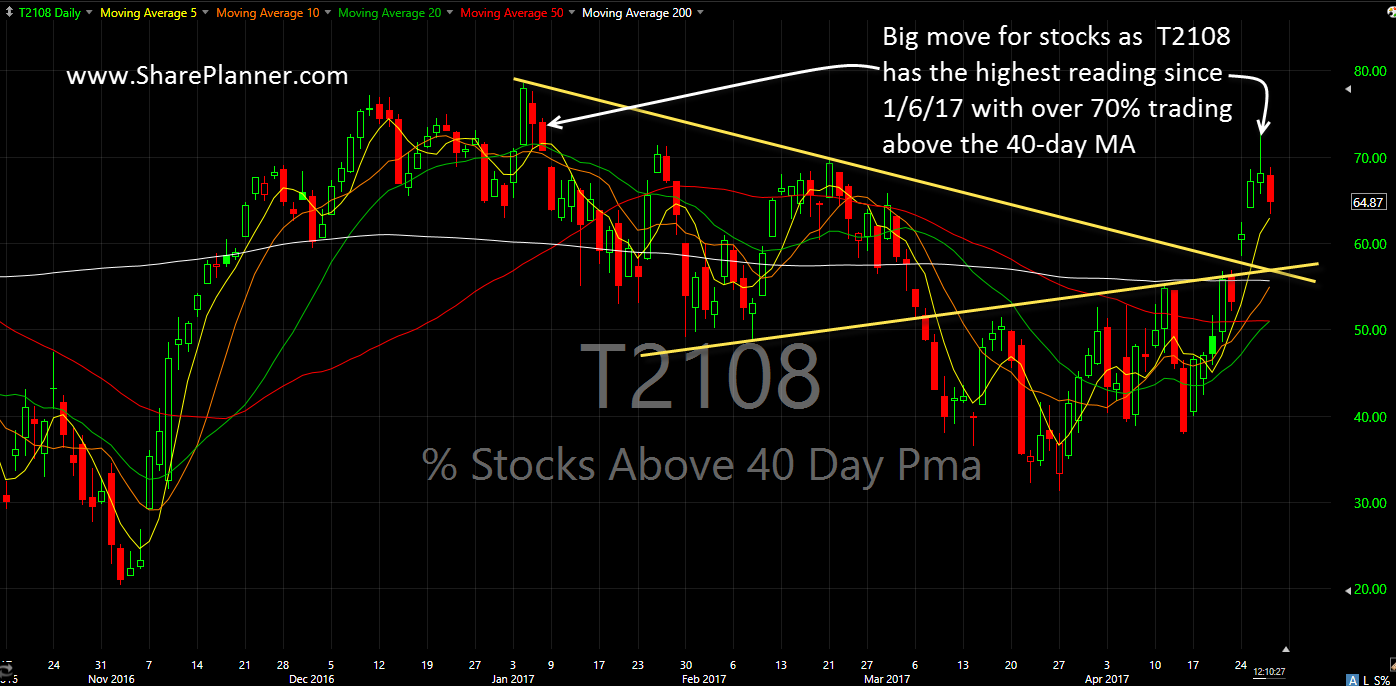
Take a look at one of my favorite stock market indicators I haven’t done a post exclusively on the T2108 in a long time, so I thought today would be a good day to do exactly that as the market has put together a very nice week so far and warrants a review of the
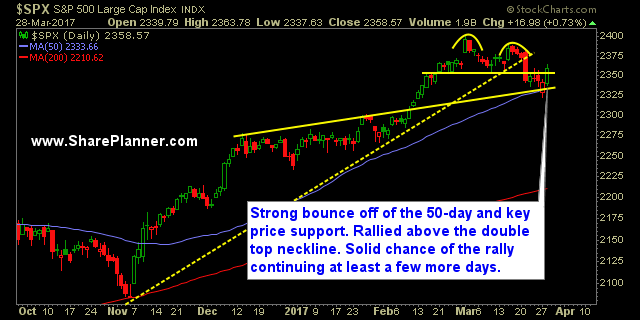
Solid bounce yesterday, but can the markets today follow through? For many years now, when we see the dead cat bounce come about, stocks overall will look to continue the bounce for several days going forward. For the markets today, will that ring true yet again? The futures are slightly down, but that has
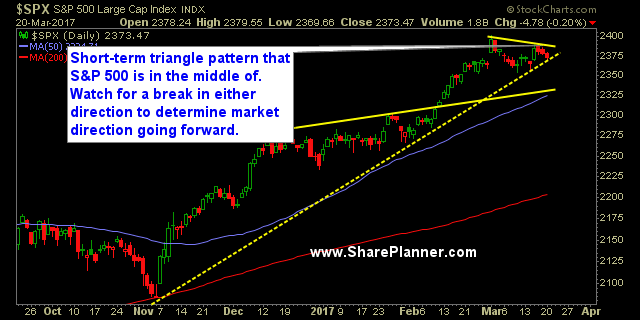
Short-term triangle pattern on SPX SPX has been coiling in a triangle pattern the past three weeks now, or essentially, this entire month of trading. It has pulled back to the rising trend-line that forms the bottom half of the triangle pattern. However, it has only experienced a mild, light volume pullback over the past
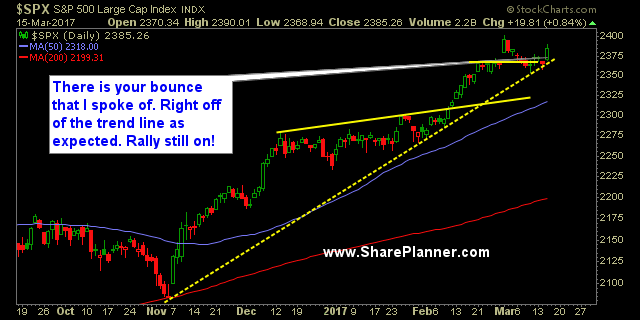
Watch the trend-line on the chart of the S&P 500 A lot can change here today or this week if the rising trend-line as noted in the chart of the S&P 500 below fails to hold. You have a potential topping pattern – emphasis on “potential” – with a new all time high that was
The Fed Up Rally Takes Price Back to Almost All-Time Highs Of couse I am using a play on words as this Fed Up Trump Rally is hated and despised by most and defies the logic of investing in general. I mean, c'mon it has been since last October - almost a half of a
