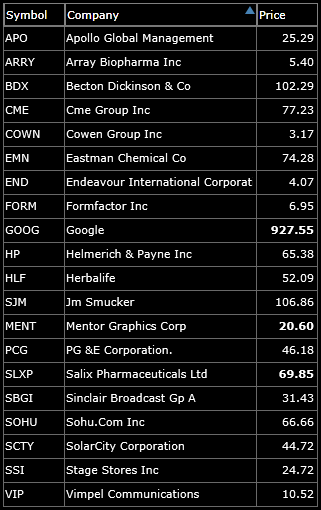
As always on Mondays, I have my long watch-list for the week. Of course throughout the duration of the week, I am likely to add/subtract from it. But this is where it stands at the moment. But let me just say this, the market is on an unbelievable tear right now. Nasdaq is

I know that there is a lot of controversy behind Herbalife (HLF) and rumors that it is some kind of ponzi scheme, Carl Icahn’s position in the stock or why Bill Ackman has made his short position in the stock such a personal one. All that talk, news and made-for-tv debate is senseless and pointless
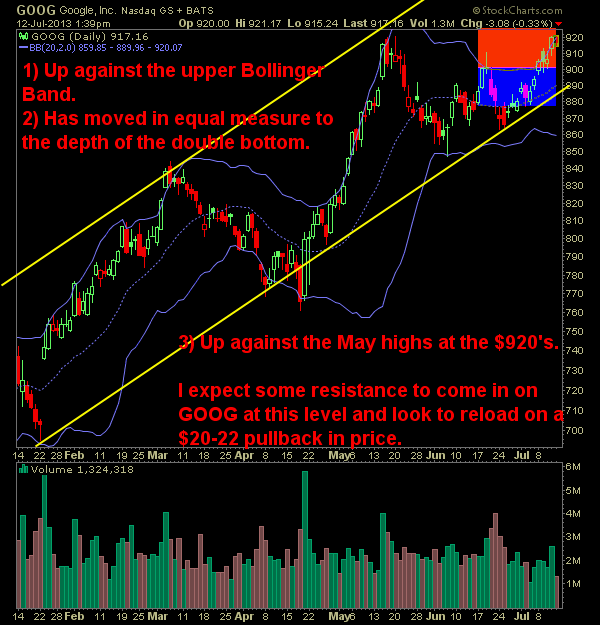
I was long Google (GOOG) from the end of June when I got long on a pullback that held key support and got in at $872.15. Yesterday I sold that position at $920.30 for a nice 5.5% gain. But why sell so soon? Look no further than the chart I posted below for a
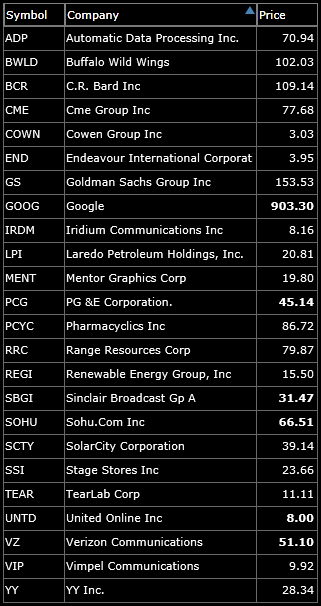
I’m back from my brief stint with vacation. Believe it or not, it was the first time in about three and one-half years since I took my last one. It felt great camping with the family despite the non-stop rain for the entire vacation’s duration. With that said, a result of last week’s vacation is

Chart of the day… All sorts of long standing streaks are coming to an end these days in the financial markets… I’m going to have to find something else to write about soon 🙂 Quick Glance at the Market Heat Map and Industries Notables: That is what you call a market sunburn Financials continues to
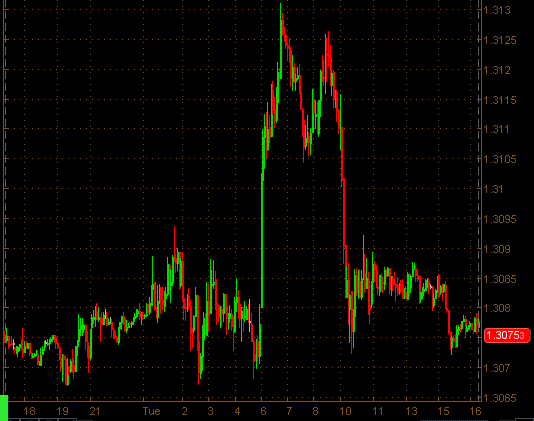
One of the most extreme intraday double tops you’ll ever see (this comes from the EUR/USD)… Quick Glance at the Market Heat Map and Industries Notables: Technology shows a lot of heavy weakness. Banks cooled down a little bit. Consumer Goods and Utilities boucned back nicely. Be sure to check out my latest
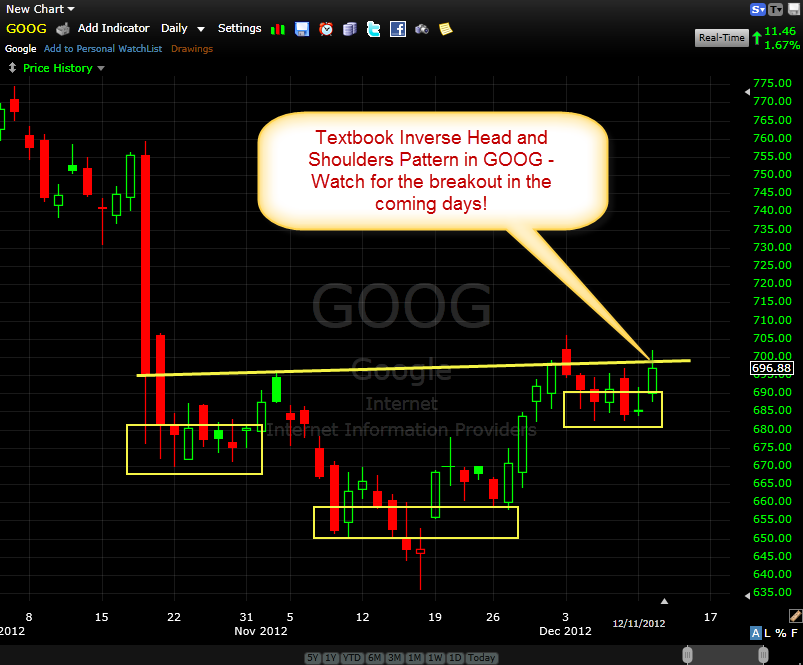
Inverse head and shoulders pattern in Google (GOOG) might be Santa’s Christmas gift to us Quick Glance at the Market Heat Map and Industries Notables: Technology firing on all cylinders for the first time in a loooooong time. Healthcare took off today. Materials showed moderate strength, while Finance was mixed. Be sure to check

The Chart of the Day… Quick Glance at the Market Heat Map and Industries Notables: This specific heat-map color arrangement seems to becoming far too regular on the Evening Tape. The three industries you don’t want to see lead to the downside: Financials, Materials, and Technology all led to the downside today.

The Chart of the Day… Like I said… a joke… not true support. Trades Made Today: 1. Day-Traded FB for a 0.58% loss from $19.07 to $18.96 2. Shorted EXPD at $35.65. 3. See my past performance as a swing-trader Quick Glance at the Market Heat Map and Industries Notables: What was shaping up

Cramer doesn't know what to think! Cancel All Orders! My all-time favorite trading video comes into play here called "Cramer Doesn't Know What to Think, Cancel All Orders!", with the sell-off from Google's surprise earnings release (accidentally of course). Ultimately we'll probably look back on this day and think what an opportunity it was

spc@shareplanner.com
(904) 800-8420
© Copyright 2025 | SharePlanner Inc. All Rights Reserved.
Disclaimer: The information provided on this website is for educational and informational purposes only. Ryan Mallory and/or SharePlanner are not licensed financial advisors, brokers, or tax professionals. The content on this site should not be considered as financial, investment, tax, or legal advice.
All information and opinions expressed herein are based on sources believed to be accurate and reliable. However, we make no representation or warranty as to their accuracy, completeness, or reliability. Any action you take upon the information on this website is strictly at your own risk.
Past performance is not indicative of future results. Investing involves risk, including the possible loss of principal. All investors should make their own decisions based on their specific investment objectives and financial circumstances.
This site may contain links to external websites that are not provided or maintained by or in any way affiliated with Ryan Mallory and/or SharePlanner. Please note that Ryan Mallory and/or SharePlanner do not guarantee the accuracy, relevance, timeliness, or completeness of any information on these external websites.
By using this website, you agree that Ryan Mallory and/or SharePlanner and any affiliated parties are not responsible for any losses or damages resulting from your use of or reliance on the information provided.
It is strongly recommended that you consult with a qualified professional before making any financial decisions.