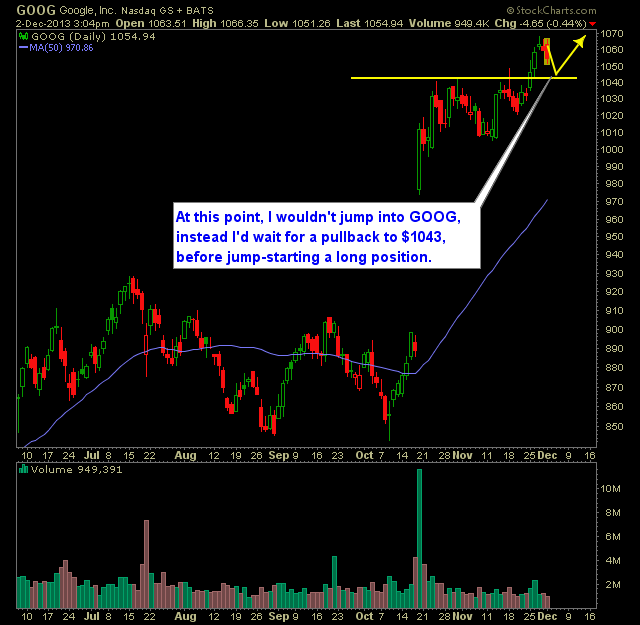
At this point, I wouldn’t jump into Google (GOOG), instead I’d wait for a pullback to $1043, before jump-starting a long position. The pullback over the last two days looks fairly harlmless and one to be taken advantage of here once it hits my price. I’ve made a career off of buying the light

Textbook breakout here in Google (GOOG). Ideally if you can get in on a pullback to $1043, it would offer a great risk/reward opportunity. Also, follow the currently trend-line as I have outlined below, if this stock runs hard towards $1,100, use a break of the trend-line to cut-line and get out of the trade.
This morning the market is trying to run and whipe out some of the previous day’s worth of losses. As it stands right now, the bears haven’t siezed the moment and the bulls are by no means out of the woods yet, so the key here then becomes patiently waiting to make the next move.
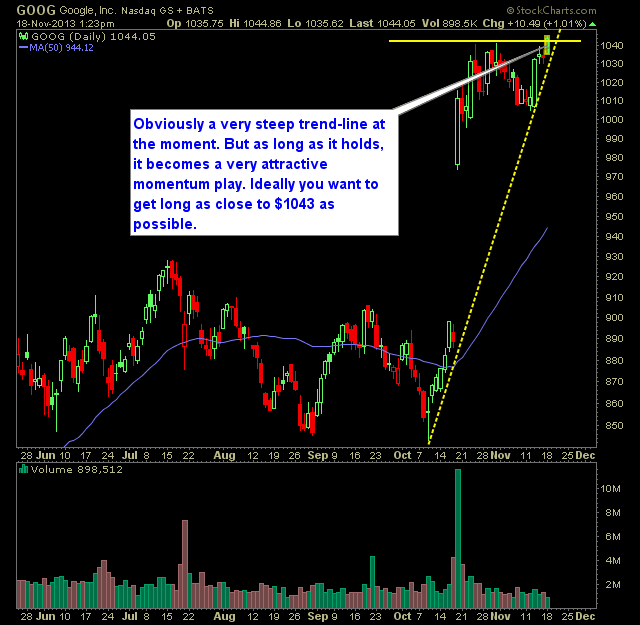
Obviously a very steep trend-line at the moment. But as long as it holds, it becomes a very attractive momentum play. Ideally you want to get long Google (GOOG) as close to $1043 as possible. Which is right about where it is currently trading. I’m honestly surprised it is doing this well. Last week,
Typically there is nothing more painful then me trying to put together a solid SharePlanner video. Either the recording device crashes or the mic is never turned on, or something in the realm of an operator error takes place. For the second week in a row, the lawn care folks have decided to ambush my
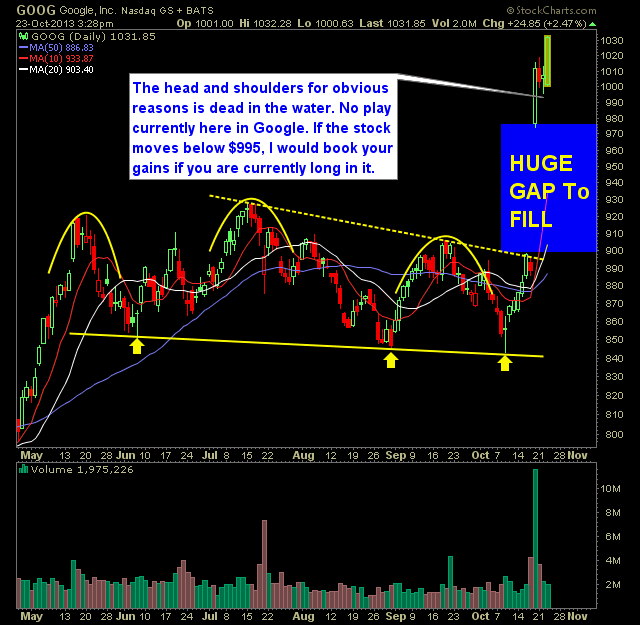
The head and shoulders for obvious reasons is dead in the water. No play currently here in Google. If the stock moves below $995, I would book your gains if you are currently long in it. Here’s the technical analysis on GOOG:

GOOG is by no means out of the woods yet – this stock is clearly in a distribution pattern if I’ve ever seen one. There is a clear support level for this stock as it bounced for the third time. If that breaks at $841, the bulls are doomed. Ok, not doomed, but they stand
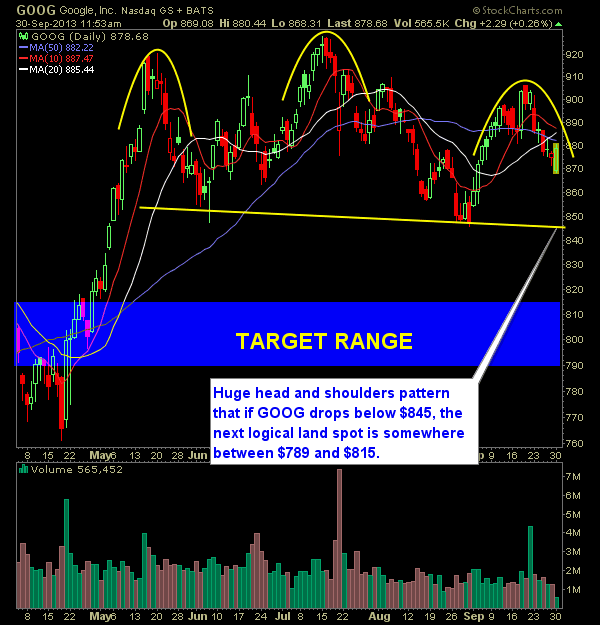
Google (GOOG) has been a great stock for swing trading this year. The key has been fading the moves that have occurred. Specifically those between $850 and $930. But as a result of those moves a nasty head and shoulders pattern has emerged that should take this stock much lower if it crosses and
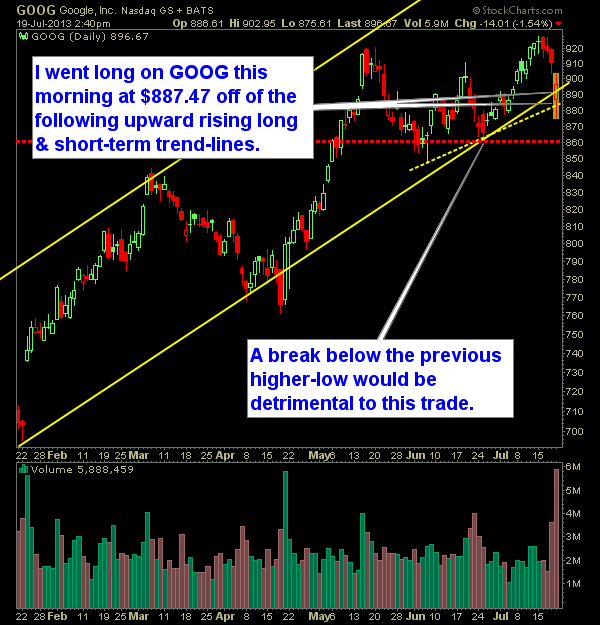
I have to follow up on my Google (GOOG) post from July 12th, when I warned traders to get out of GOOG when it was well over $920. The stock has a history of not performing well in consideration of the price pattern that had matured, the over extension outside of the upper Bollinger
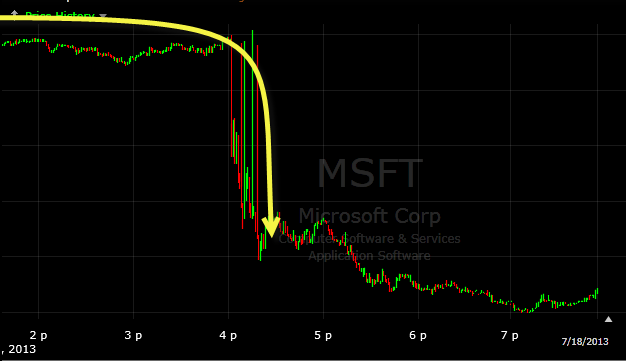
Microsoft (MSFT) and Google (GOOG) get HAMMERED after hours. Quick Glance at the Market Heat Map and Industries Notables: Oh my gosh! Banks were freakin’ phenomenal – where have you been all my life!?! It was like tech knew ahead a time after hours were going to be a disaster. Healthcare wasn’t too far behind

spc@shareplanner.com
(904) 800-8420
© Copyright 2025 | SharePlanner Inc. All Rights Reserved.
Disclaimer: The information provided on this website is for educational and informational purposes only. Ryan Mallory and/or SharePlanner are not licensed financial advisors, brokers, or tax professionals. The content on this site should not be considered as financial, investment, tax, or legal advice.
All information and opinions expressed herein are based on sources believed to be accurate and reliable. However, we make no representation or warranty as to their accuracy, completeness, or reliability. Any action you take upon the information on this website is strictly at your own risk.
Past performance is not indicative of future results. Investing involves risk, including the possible loss of principal. All investors should make their own decisions based on their specific investment objectives and financial circumstances.
This site may contain links to external websites that are not provided or maintained by or in any way affiliated with Ryan Mallory and/or SharePlanner. Please note that Ryan Mallory and/or SharePlanner do not guarantee the accuracy, relevance, timeliness, or completeness of any information on these external websites.
By using this website, you agree that Ryan Mallory and/or SharePlanner and any affiliated parties are not responsible for any losses or damages resulting from your use of or reliance on the information provided.
It is strongly recommended that you consult with a qualified professional before making any financial decisions.