
Well I have to say that gap down came in a very interesting time. Last week as many of you remember I was expecting the 156.45 level to be the top for the year. I also had a 156.70 for my 2nd target on the $SPY level which represented the all time high in the $SPY.
I am not going to brag about getting that very close since 156.80 was the top just because I have found some really great piece of information.
As many of you may know I have cherished and learned so much form Steven Place @stevenplace knowledge. I primarily learned Fibonacci Levels and projected lines from his videos on youtube (Steven Place Channel)
During the weekend I was trying to search for some great information to where this market could go, and how could I translate that information to my readers, in a way where the trend could be more visible. I was so certain that I could find that answer by watching just one video from Steven Place. And guess what? He had just the perfect video this weekend.
The video is entitled Long Term Measured Moves in the S&P 500. In this video he does what he does best, draw projected lines to help traders see what the possible trend is. Everything goes very smooth as usual, but on mark 3:57 of this 5:34 minute long video is where I had my good idea and which is what i have been doing on all his other videos. Instead of drawing another parallel line, I go ahead and draw a Fibonacci Level line parallel to the last one, and just move it to the next level. And this is what it looks like at the end.
$SPX Weekly Chart
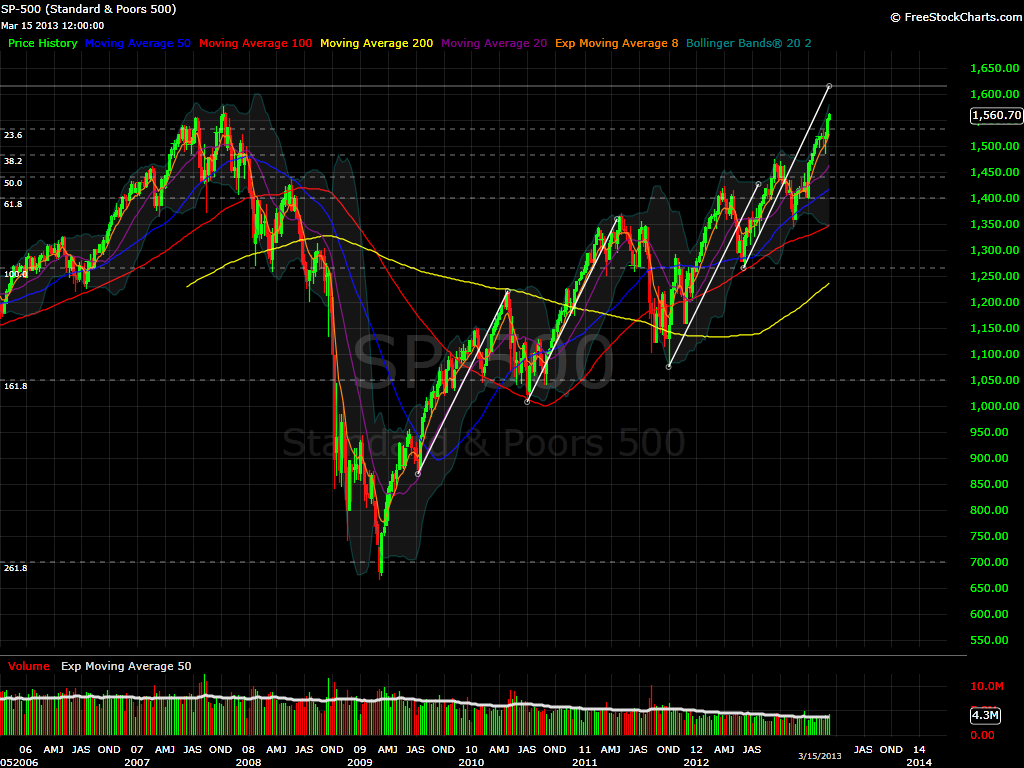
Notice how the Fibonacci Levels stating around 6/8/12 coincide with the recent moves in the $SPX. It clearly show all the pullbacks, and also where support was recently found. If you can make some sense of this precious information, you will do very well, and also give me the opportunity to be more precise again on my $SPY reads.
You notice that at any point I mentioned the news about Cyprus. I just want you to look at these charts, and as far as I know, this should be enough to help you navigate the next 45 days.
$SPY 1st support is 153.79 2nd support 153.35 (just above the 23.6% Fibonacci Level) and 3rd is 152.96.
$SPY 1st target is 154.46, 2nd is 155.55, 3rd is 156.45, and 4rd is 156.80.
Trade what you see not what you think.


Welcome to Swing Trading the Stock Market Podcast!
I want you to become a better trader, and you know what? You absolutely can!
Commit these three rules to memory and to your trading:
#1: Manage the RISK ALWAYS!
#2: Keep the Losses Small
#3: Do #1 & #2 and the profits will take care of themselves.
That’s right, successful swing-trading is about managing the risk, and with Swing Trading the Stock Market podcast, I encourage you to email me (ryan@shareplanner.com) your questions, and there’s a good chance I’ll make a future podcast out of your stock market related question.
Watching the dollars rise and fall in your trading account can turn a well-planned swing trade into an emotional, deeply personal decision. In this episode, I explain why focusing on price action, percentage returns, and R-multiples can help you avoid cutting winners early, holding losers too long, and abandoning your trading plan.
Be sure to check out my Swing-Trading offering through SharePlanner that goes hand-in-hand with my podcast, offering all of the research, charts and technical analysis on the stock market and individual stocks, not to mention my personal watch-lists, reviews and regular updates on the most popular stocks, including the all-important big tech stocks. Check it out now at: https://www.shareplanner.com/premium-plans
📈 START SWING-TRADING WITH ME! 📈
Click here to subscribe: https://shareplanner.com/tradingblock
— — — — — — — — —
💻 STOCK MARKET TRAINING COURSES 💻
Click here for all of my training courses: https://www.shareplanner.com/trading-academy
– The A-Z of the Self-Made Trader –https://www.shareplanner.com/the-a-z-of-the-self-made-trader
– The Winning Watch-List — https://www.shareplanner.com/winning-watchlist
– Patterns to Profits — https://www.shareplanner.com/patterns-to-profits
– Get 1-on-1 Coaching — https://www.shareplanner.com/coaching
— — — — — — — — —
❤️ SUBSCRIBE TO MY YOUTUBE CHANNEL 📺
Click here to subscribe: https://www.youtube.com/shareplanner?sub_confirmation=1
🎧 LISTEN TO MY PODCAST 🎵
Click here to listen to my podcast: https://open.spotify.com/show/5Nn7MhTB9HJSyQ0C6bMKXI
— — — — — — — — —
💰 FREE RESOURCES 💰
— — — — — — — — —
🛠 TOOLS OF THE TRADE 🛠
Software I use (TC2000): https://bit.ly/2HBdnBm
— — — — — — — — —
📱 FOLLOW SHAREPLANNER ON SOCIAL MEDIA 📱
*Disclaimer: Ryan Mallory is not a financial adviser and this podcast is for entertainment purposes only. Consult your financial adviser before making any decisions.

You Might Like

South Korea: The Hidden Driver of US Tech Volatility

Stop Trying to Hit Home Runs: Start Trading Within Your Means

How to Trade Breakouts Without Getting Trapped