
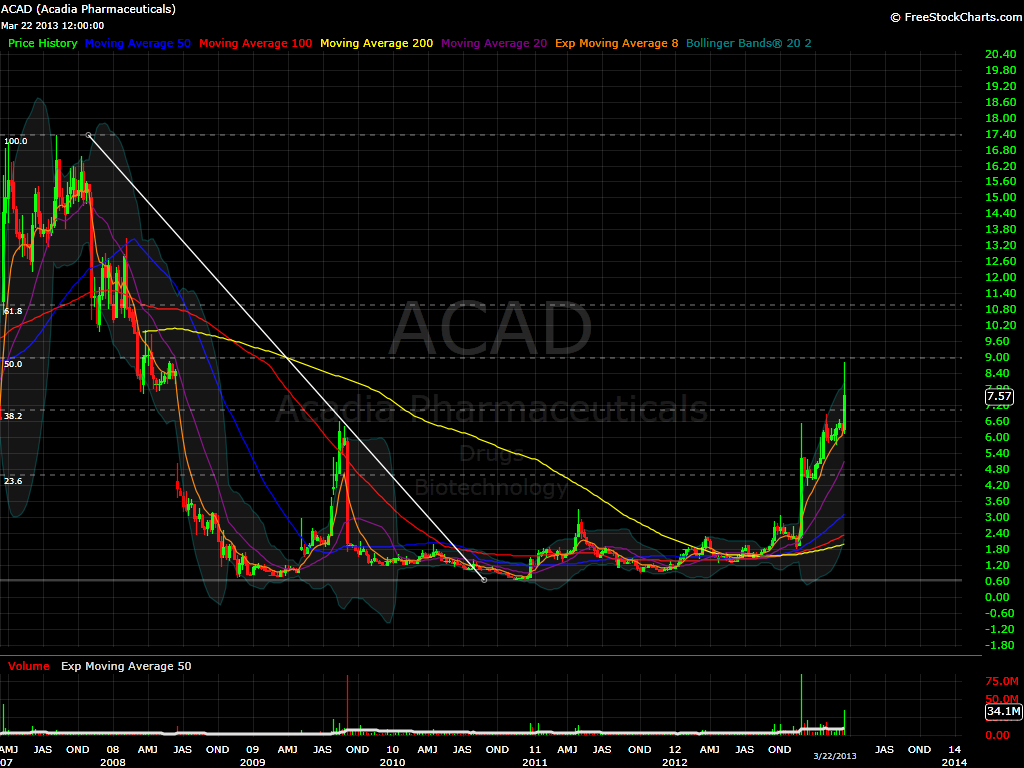
$ACAD Weekly Chart – I really thought it was going to reach it’s 8.98 target last week which represents the 50% Fibonacci Level, but it did give up so close. Today it is openining high. This one should be interestingtoday.
$APOL Daily Chart – Nice pop in this name. It needs to hold strong over the 19.13 level, or it will easily fill the gap left behind.

$ARMH 4 Hour Chart – gaping between 2 Fibonacci levels, I can’t take anything like this at this point. But I certainly will make a move once it touches the top 23.6% or bottom 38.2% range.

$ARNA Daily Chart – Not too much strength in this move. Let’s see how it will handle a pullback to 8.23 again. If it holds it looks good for another 15%+ run to 9.47.

$DELL Daily Chart – Opening right at the 61.8% Fibonacci level. I doubt that it got much more, so that 14.67 level is the place where it holds or folds.

$DRYS Daily Chart – This one looks poised to make a run to 2.37. I have been saying this for a while, so I looking for thie to happen soon.

$TSRX 2 day chart – Opening above the 7.25 Fibonacii level, which also represents the 61.8%. I want to see what it will do once it gets there.

$VOD Weekly Chart – Another gap just a little higher than last week. I want to see what happens once it re-test the 28.15 level again. I think this time it will fail.

$ZNGA Daily Chart – Come on $ZNGA get to 3.72, so we can talk seriously.


Welcome to Swing Trading the Stock Market Podcast!
I want you to become a better trader, and you know what? You absolutely can!
Commit these three rules to memory and to your trading:
#1: Manage the RISK ALWAYS!
#2: Keep the Losses Small
#3: Do #1 & #2 and the profits will take care of themselves.
That’s right, successful swing-trading is about managing the risk, and with Swing Trading the Stock Market podcast, I encourage you to email me (ryan@shareplanner.com) your questions, and there’s a good chance I’ll make a future podcast out of your stock market related question.
How should one go from their regular 9-5 job into full-time trading? As a swing trader, we don't have to necessarily be full-time, and instead we can combine our trading into a lifestyle that allows us to maximize our time and earning ability.
Be sure to check out my Swing-Trading offering through SharePlanner that goes hand-in-hand with my podcast, offering all of the research, charts and technical analysis on the stock market and individual stocks, not to mention my personal watch-lists, reviews and regular updates on the most popular stocks, including the all-important big tech stocks. Check it out now at: https://www.shareplanner.com/premium-plans
📈 START SWING-TRADING WITH ME! 📈
Click here to subscribe: https://shareplanner.com/tradingblock
— — — — — — — — —
💻 STOCK MARKET TRAINING COURSES 💻
Click here for all of my training courses: https://www.shareplanner.com/trading-academy
– The A-Z of the Self-Made Trader –https://www.shareplanner.com/the-a-z-of-the-self-made-trader
– The Winning Watch-List — https://www.shareplanner.com/winning-watchlist
– Patterns to Profits — https://www.shareplanner.com/patterns-to-profits
– Get 1-on-1 Coaching — https://www.shareplanner.com/coaching
— — — — — — — — —
❤️ SUBSCRIBE TO MY YOUTUBE CHANNEL 📺
Click here to subscribe: https://www.youtube.com/shareplanner?sub_confirmation=1
🎧 LISTEN TO MY PODCAST 🎵
Click here to listen to my podcast: https://open.spotify.com/show/5Nn7MhTB9HJSyQ0C6bMKXI
— — — — — — — — —
💰 FREE RESOURCES 💰
— — — — — — — — —
🛠 TOOLS OF THE TRADE 🛠
Software I use (TC2000): https://bit.ly/2HBdnBm
— — — — — — — — —
📱 FOLLOW SHAREPLANNER ON SOCIAL MEDIA 📱
*Disclaimer: Ryan Mallory is not a financial adviser and this podcast is for entertainment purposes only. Consult your financial adviser before making any decisions.
You Might Like

The Retail Trading Revolution: How Small Investors Are Reshaping the Stock Market

Fading the Gap: How Large Overnight Moves in SPY and QQQ Play Out During the Trading Day

How to Trade a Bear Flag