
$ALXA 4 Hour Chart – Gaping up practically 3 Fibonacci Levels. For this move to have legs, it needs to hold above 4.74.

$ARMH Daily Chart – Gaping up just above a fib level. Needs to stay above 42.37, if it doesn’t then it will be a short.

$ASTX 8 Day Chart – This stock was the biggest winner of my setups yesterday. I think it got legs to 5.44. Maybe more.

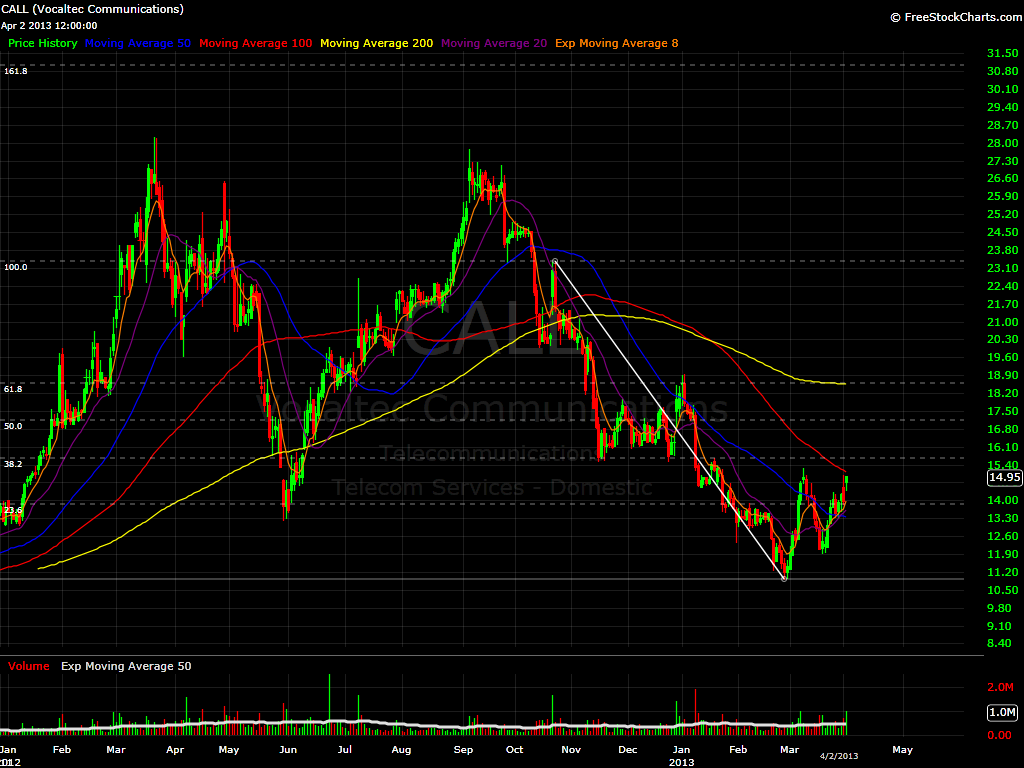
$CALL daily chart – Gaping up two fibonacci levels. This one better hold above 17.12 which represents the 50% fib level. This could be a nice short if it breaks below that level.
$FB 2 Hour – I simply don’t believe on any bounce coming from $FB. This is one is heading to 24 in my honest opinion. It’s got no business until it gets there.

$GLUU Daily chart – Above 2.82 is the launch pad, that is all I got to say about it.

$HIMX 6 Days chart – Trying to go to that 6.28 which represents the 61.8% Fibonacci level. Not my cup of tea to be honest. I rather wait until it gets there, or break down below 5.18.

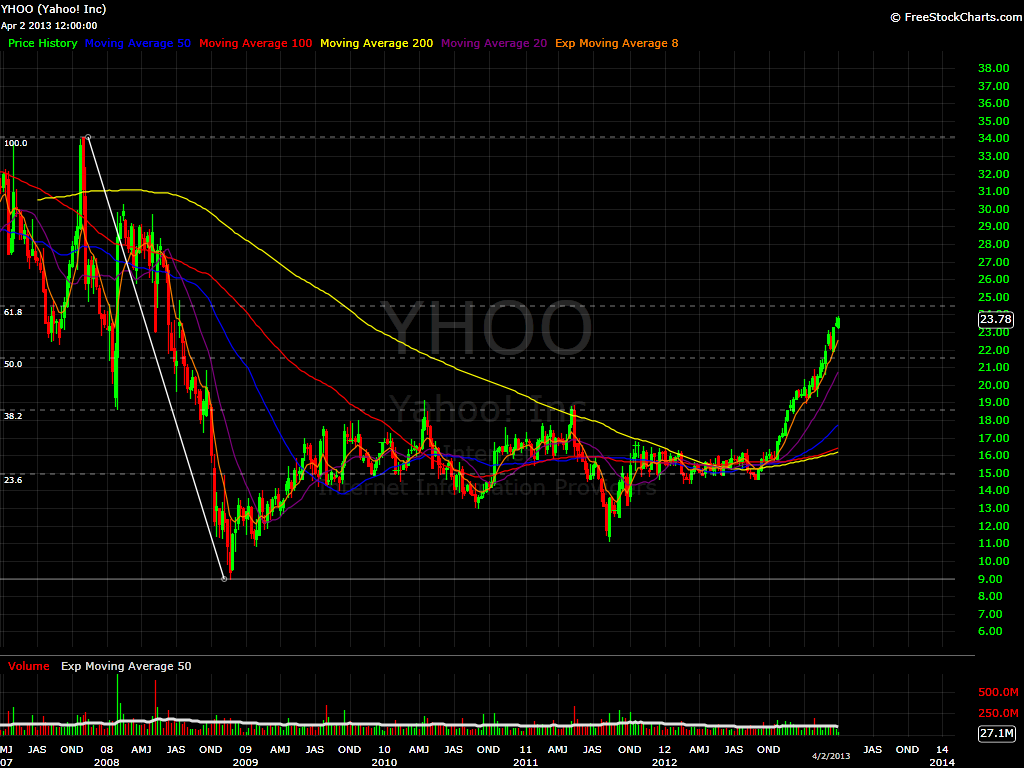
$YHOO weekly Chart – Yes 24.50 is still the current target. It has been going up for weeks now. It shows up on my scans every morning.
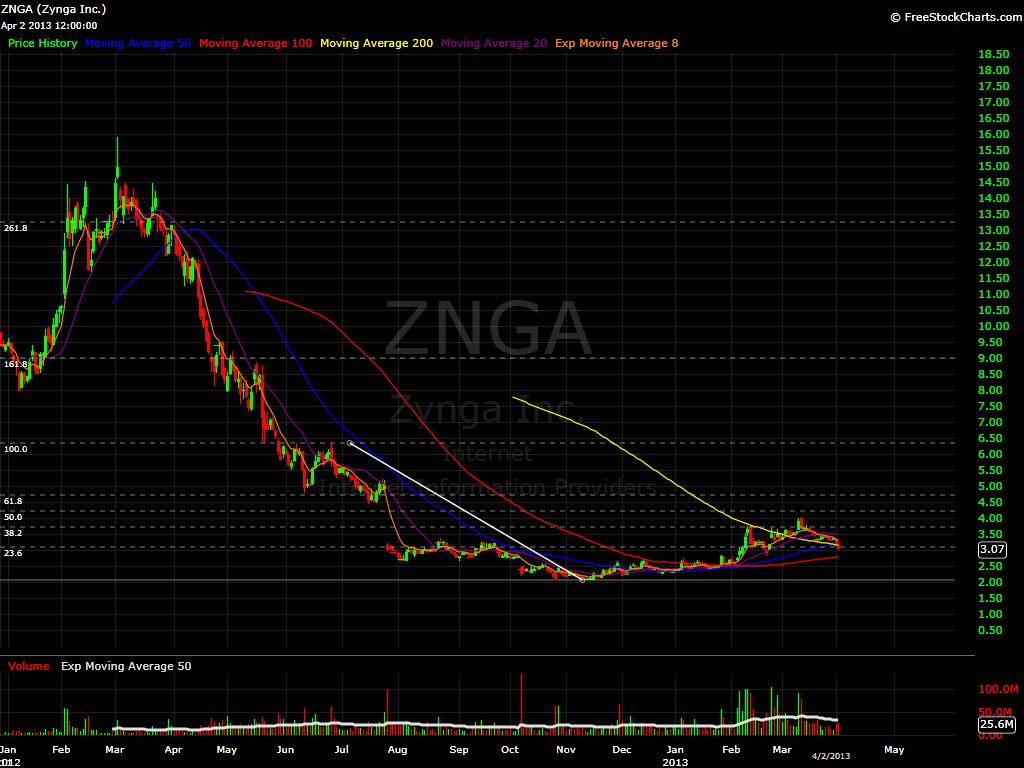
$ZNGA Daily chart – It rested the whole afternoon on the 3.10 level. I was ready to take it at 3.11. I wake up this morning with it gaping half way to the next fib level @ 3.72. Tough to take it here. Maybe I will get lucky and it pullsback, so I can get a better entry.


Welcome to Swing Trading the Stock Market Podcast!
I want you to become a better trader, and you know what? You absolutely can!
Commit these three rules to memory and to your trading:
#1: Manage the RISK ALWAYS!
#2: Keep the Losses Small
#3: Do #1 & #2 and the profits will take care of themselves.
That’s right, successful swing-trading is about managing the risk, and with Swing Trading the Stock Market podcast, I encourage you to email me (ryan@shareplanner.com) your questions, and there’s a good chance I’ll make a future podcast out of your stock market related question.
In today's episode, I explain whether it is a good idea or not to rapidly increase the size of your portfolio if you come across a sum of cash. A lot of traders will do this without ever recognizing the emotional toll it can have on you as a swing trader and the awful mistakes you can make in doing so.
Be sure to check out my Swing-Trading offering through SharePlanner that goes hand-in-hand with my podcast, offering all of the research, charts and technical analysis on the stock market and individual stocks, not to mention my personal watch-lists, reviews and regular updates on the most popular stocks, including the all-important big tech stocks. Check it out now at: https://www.shareplanner.com/premium-plans
📈 START SWING-TRADING WITH ME! 📈
Click here to subscribe: https://shareplanner.com/tradingblock
— — — — — — — — —
💻 STOCK MARKET TRAINING COURSES 💻
Click here for all of my training courses: https://www.shareplanner.com/trading-academy
– The A-Z of the Self-Made Trader –https://www.shareplanner.com/the-a-z-of-the-self-made-trader
– The Winning Watch-List — https://www.shareplanner.com/winning-watchlist
– Patterns to Profits — https://www.shareplanner.com/patterns-to-profits
– Get 1-on-1 Coaching — https://www.shareplanner.com/coaching
— — — — — — — — —
❤️ SUBSCRIBE TO MY YOUTUBE CHANNEL 📺
Click here to subscribe: https://www.youtube.com/shareplanner?sub_confirmation=1
🎧 LISTEN TO MY PODCAST 🎵
Click here to listen to my podcast: https://open.spotify.com/show/5Nn7MhTB9HJSyQ0C6bMKXI
— — — — — — — — —
💰 FREE RESOURCES 💰
— — — — — — — — —
🛠 TOOLS OF THE TRADE 🛠
Software I use (TC2000): https://bit.ly/2HBdnBm
— — — — — — — — —
📱 FOLLOW SHAREPLANNER ON SOCIAL MEDIA 📱
*Disclaimer: Ryan Mallory is not a financial adviser and this podcast is for entertainment purposes only. Consult your financial adviser before making any decisions.
You Might Like

The Retail Trading Revolution: How Small Investors Are Reshaping the Stock Market

Fading the Gap: How Large Overnight Moves in SPY and QQQ Play Out During the Trading Day

How to Trade a Bear Flag