
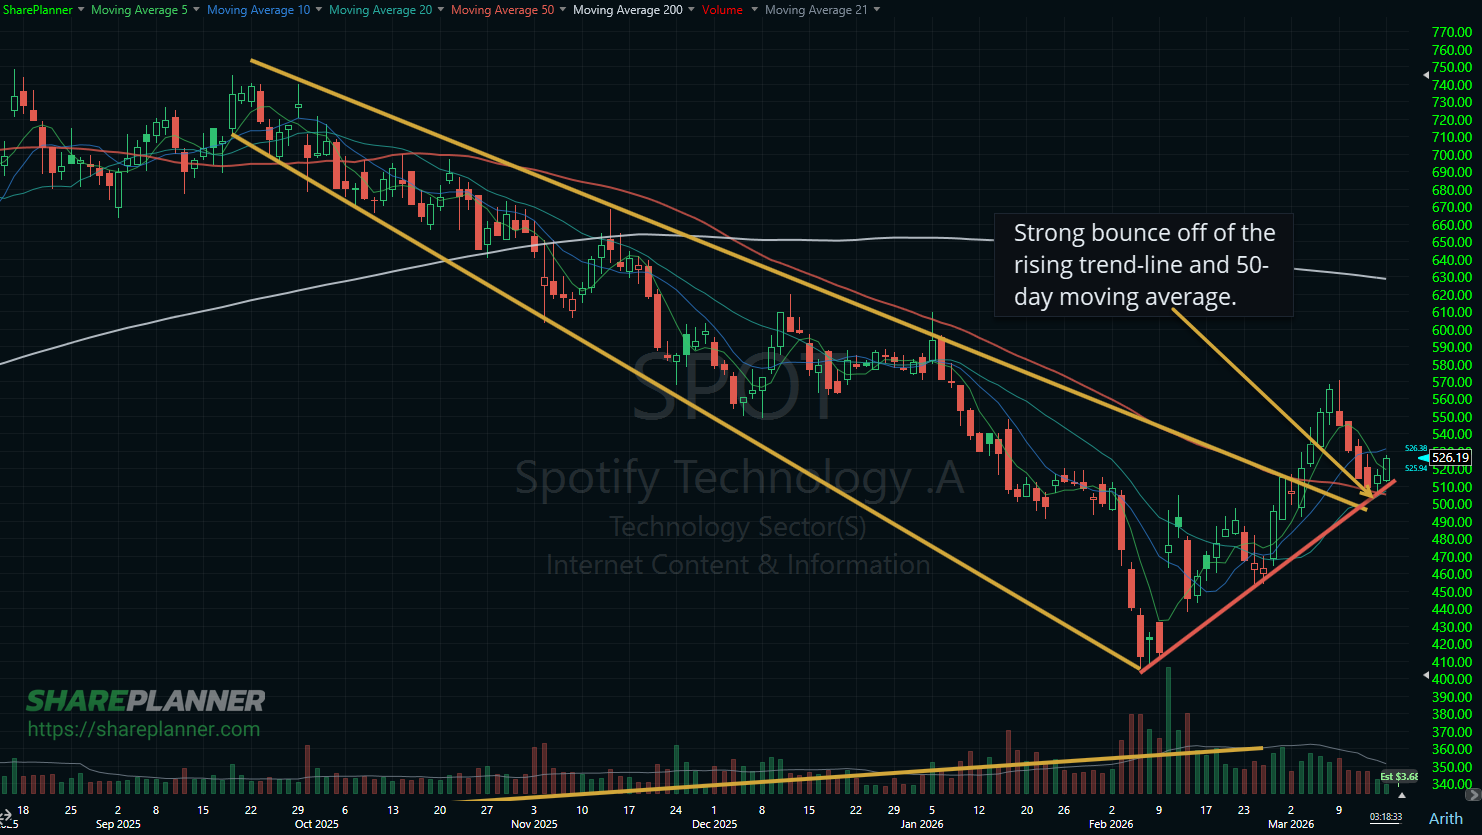
Spotify (SPOT) just did something worth paying attention to. After breaking above a declining resistance line and reclaiming the 50-day moving average, the stock pulled back for four days, found support on a rising trendline, held, and is now bouncing. That’s not random. That’s a chart telling you something.
And the lesson here goes well beyond Spotify. This is one of those setups that repeats itself across dozens of stocks every year, in every market condition. If you know what to look for, it becomes one of the more reliable patterns a swing trader can trade.
So let’s break down what’s happening on the chart, what it means for SPOT right now, and what you should carry forward into every future trade.
Breaking Above Declining Resistance
For a while, SPOT had a pattern of lower highs. Each rally ran into a wall, got rejected, and gave back the gains. That declining resistance line is a real thing. It represents sellers who have been consistent and in control.
When a stock finally punches through that line with conviction, the dynamic shifts. The sellers who had been winning are now on the wrong side. And buyers start showing up with more urgency.
That’s what happened with SPOT. The break above declining resistance was the first signal that the balance of power was shifting.
Reclaiming the 50-Day Moving Average
The 50-day moving average had been acting as resistance for SPOT prior to the breakout. That matters. When a key moving average flips from resistance to support, it tells you that the market’s perception of the stock has changed.
Getting above the 50-day is one thing. Staying above it is what confirms the move. A lot of breakouts fail right here. The stock clears the level, gets some excitement, then falls right back below it. That’s a failed breakout, and it’s one of the most common traps traders fall into.
SPOT avoided that trap. It broke out, held above the 50-day, and then dealt with a short-term pullback on its own terms.
The Rising Trendline From the February Lows
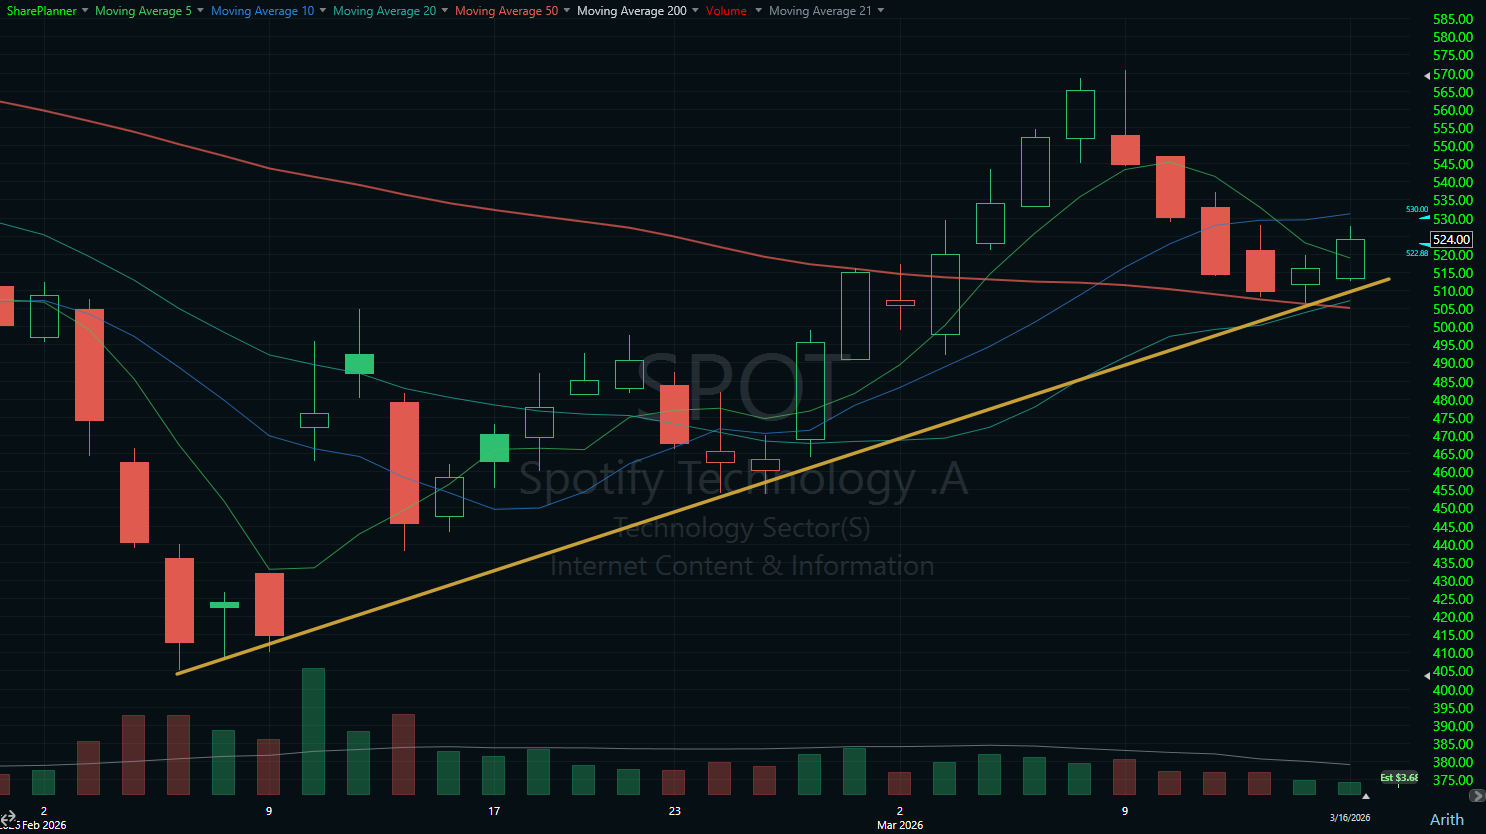
A rising trendline drawn from the early February lows has been quietly doing its job. Each bounce off that line has been meaningful. It’s not just a line on a chart. It represents a series of higher-lows, which is the foundation of any uptrend worth trading.
After the breakout above declining resistance, SPOT pulled back and touched that rising trendline. Four days of selling. Four days where traders who missed the initial move probably felt relieved they didn’t chase it. And then the stock held.
That’s the setup.
The Four-Day Pullback and the Bounce
Let me be clear about what a healthy pullback looks like, because not all pullbacks are created equal.
A healthy pullback after a breakout:
- Happens on lighter volume than the breakout itself
- Pulls back to a logical, identifiable support level
- Does not undercut the original breakout area in a decisive way
- Holds that support and turns back higher
SPOT checked those boxes. The stock pulled back to the rising trendline, tested it, and is now bouncing. That is constructive price action. That’s the chart behaving the way you want it to behave.
What the First Pullback Tells You
Here’s something that took me years to fully appreciate: the first pullback after a breakout tells you more than the initial breakout itself.
The breakout shows you momentum. The pullback shows you character.
If the stock falls apart on the first sign of selling, that’s a red flag. It suggests the breakout was driven by hype or short-covering rather than genuine accumulation. But if the stock pulls back in an orderly fashion, finds support at a meaningful level, and holds without giving up the whole move, that says the buyers are still there.
They didn’t sell into strength and abandon ship. They used the pullback as a second chance to buy. That’s a completely different story than what you see in a failed breakout.
When you’re evaluating any breakout-pullback setup going forward, ask yourself: Is this a controlled pullback to a logical level, or is this a stock that’s losing its footing? The answer will guide you more than almost anything else on the chart.
What Traders Should Watch for in Similar Setups
When you see a stock break above declining resistance, reclaim a key moving average, and then pull back to a rising trendline, here’s what you want to see before getting involved:
The volume on the pullback should not be expanding. Increasing volume on a pullback suggests distribution, meaning sellers are unloading shares aggressively. That’s not what you want. You want the sellers to dry up as the stock approaches support.
The price action near support should stabilize. Look for tighter candlestick ranges, a slowing of the decline, or a clear reversal candle near the trendline. SPOT gave that to us.
And the bounce off support should come with some energy. A weak, low-volume bounce off support is less convincing than one where buyers show up with real conviction.
Risk and What Would Invalidate This Setup
No setup is bulletproof. You have to know where you’re wrong before you ever get in.
For SPOT, the setup weakens considerably if the stock loses the rising trendline on a closing basis. A close below that level doesn’t mean the stock is in freefall, but it does mean the structure we’re trading on is no longer intact. At that point, you have to either tighten your stop or step aside.
A deeper concern would be a close back below the 50-day moving average. That would suggest the breakout above declining resistance was a false move, and those tend to reverse quickly and sharply.
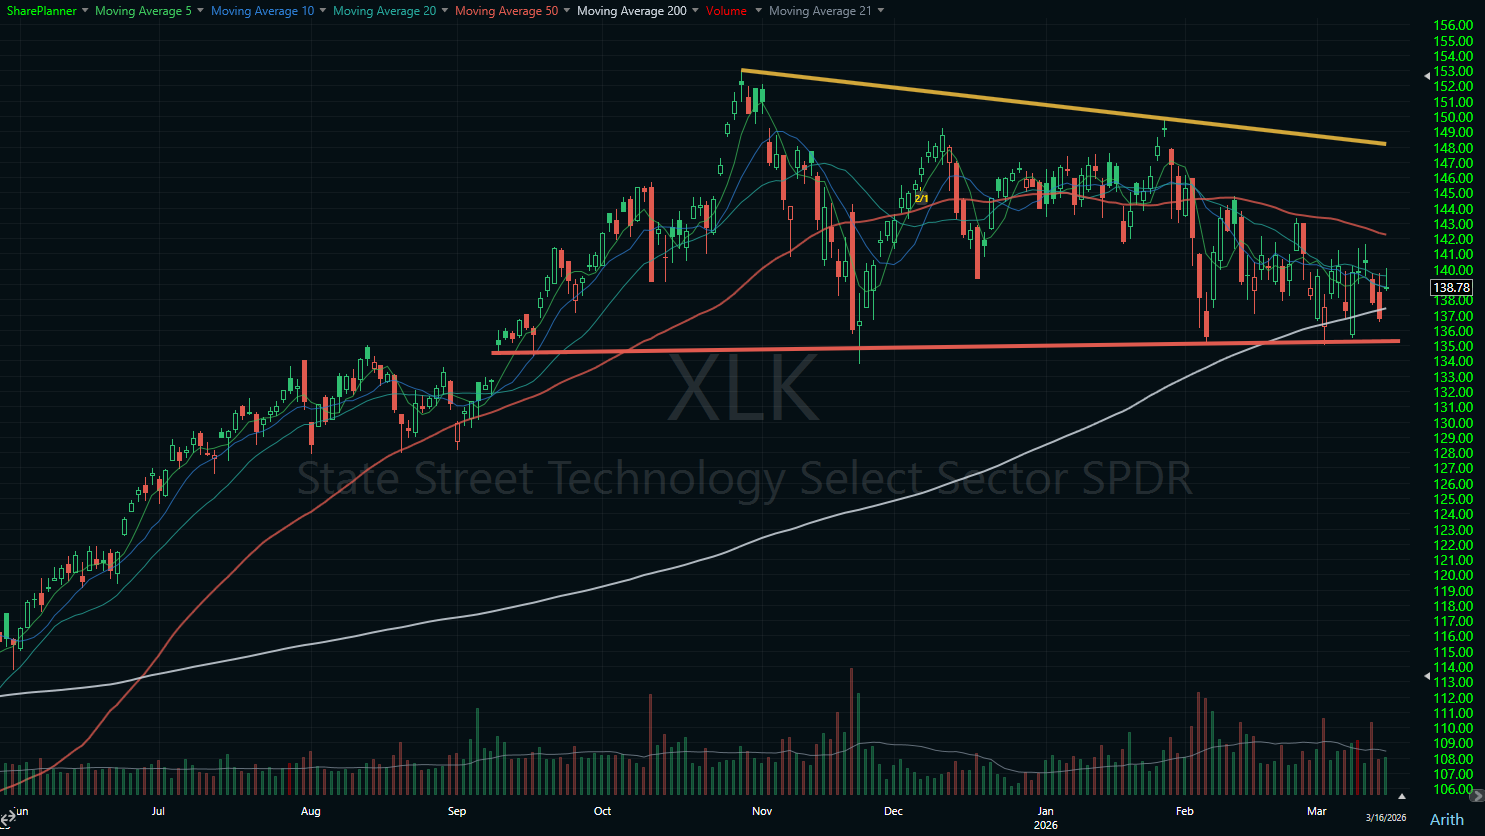
Beyond the stock itself, keep a close eye on the technology sector and the internet content industry. SPOT doesn’t trade in a vacuum. If the tech sector starts breaking down from its own support levels, the headwind on individual stocks in that group becomes significant. A rising tide helps individual boats, and the reverse is also true. The sector matters. If you see broad deterioration in the space, reduce your conviction in individual names, including SPOT.
The Broader Lesson for Swing Traders
This SPOT setup will play out in other stocks. It already has, dozens of times, and it will keep happening because the underlying dynamics never change. Stocks break resistance, pull back, and either hold their structure or give it up.
Your job as a swing trader is to be ready when the structure holds.
That means building a watchlist of stocks that have already made a strong move, waiting for the pullback to a logical support level, and then looking for evidence that the sellers are done. When that evidence shows up, you take the trade. When it doesn’t, you wait for the next one.
This is not about predicting the future. It’s about reading what the chart is telling you right now and responding with discipline. The traders who consistently profit are not the ones who guess the best. They are the ones who trade the best setups and manage their risk when those setups fail.
SPOT is giving you a live look at that process. Use it.
Become part of the Trading Block and get my trades, and learn how I manage them for consistent profits. With your subscription you will get my real-time trade setups via Discord and email, as well as become part of an incredibly helpful and knowledgeable community of traders to grow and learn with. Not sure it’s for you? You get a Free 7-Day Trial. Sign Up Today!
Frequently Asked Questions
What does it mean when a stock breaks above declining resistance?
Declining resistance forms when a stock keeps making lower highs, with sellers consistently stepping in at each rally. When the stock finally breaks above that line, it signals that the sellers who had been in control are losing their grip. Buyers are now willing to pay higher prices, and the trend may be shifting. It’s one of the more meaningful signals on a daily chart.
Why is the 50-day moving average important in technical analysis?
The 50-day moving average represents the average closing price of the last 50 trading sessions. It’s widely watched by institutional traders, which means it often becomes a self-fulfilling level of support or resistance. When a stock is trading below its 50-day, that average tends to act as a ceiling. When the stock gets back above it and holds, it often becomes a floor. The flip from resistance to support is what makes it significant.
What is a healthy pullback after a breakout?
A healthy pullback is controlled and purposeful. Volume should decrease as the stock pulls back, suggesting that sellers aren’t aggressively distributing shares. The stock should retrace to a logical support level, whether that’s a rising trendline, a prior breakout point, or a key moving average, and then hold that level without collapsing through it. The goal is to see the stock reset without giving back the entire breakout move.
How do traders use rising trendlines as support?
A rising trendline connects a series of higher lows, forming an angled floor beneath the stock’s price. Each time the stock pulls back to that line and bounces, the trendline gains more significance. Traders watch for the stock to return to that level during a pullback, looking for a hold and reversal as confirmation that buyers are still active at that support zone. The more times a trendline has been respected, the more meaningful it becomes.
What would invalidate a breakout pullback setup?
The clearest invalidation is a close below the support level being tested. If a stock pulls back to a rising trendline and closes beneath it, the structure that justified the trade is broken. A close back below the 50-day moving average after a prior breakout above it is another red flag. Beyond the stock itself, broad sector weakness can undermine an otherwise clean setup, so always consider whether the industry group is holding its own support.
Should I only trade breakout pullback setups when the sector is strong?
Not exclusively, but sector strength or weakness matters more than most traders give it credit for. When the technology sector or a specific industry group is holding above its own key support levels, the wind is at your back on individual stock trades within that space. When the sector is rolling over, you’re fighting an uphill battle even on clean individual setups. Always check the bigger picture before committing to a trade.


Welcome to Swing Trading the Stock Market Podcast!
I want you to become a better trader, and you know what? You absolutely can!
Commit these three rules to memory and to your trading:
#1: Manage the RISK ALWAYS!
#2: Keep the Losses Small
#3: Do #1 & #2 and the profits will take care of themselves.
That’s right, successful swing-trading is about managing the risk, and with Swing Trading the Stock Market podcast, I encourage you to email me (ryan@shareplanner.com) your questions, and there’s a good chance I’ll make a future podcast out of your stock market related question.
In this podcast episode Ryan explains six principles for trading in easy markets that will prepare you for the more difficult and bearish markets.
Be sure to check out my Swing-Trading offering through SharePlanner that goes hand-in-hand with my podcast, offering all of the research, charts and technical analysis on the stock market and individual stocks, not to mention my personal watch-lists, reviews and regular updates on the most popular stocks, including the all-important big tech stocks. Check it out now at: https://www.shareplanner.com/premium-plans
📈 START SWING-TRADING WITH ME! 📈
Click here to subscribe: https://shareplanner.com/tradingblock
— — — — — — — — —
💻 STOCK MARKET TRAINING COURSES 💻
Click here for all of my training courses: https://www.shareplanner.com/trading-academy
– The A-Z of the Self-Made Trader –https://www.shareplanner.com/the-a-z-of-the-self-made-trader
– The Winning Watch-List — https://www.shareplanner.com/winning-watchlist
– Patterns to Profits — https://www.shareplanner.com/patterns-to-profits
– Get 1-on-1 Coaching — https://www.shareplanner.com/coaching
— — — — — — — — —
❤️ SUBSCRIBE TO MY YOUTUBE CHANNEL 📺
Click here to subscribe: https://www.youtube.com/shareplanner?sub_confirmation=1
🎧 LISTEN TO MY PODCAST 🎵
Click here to listen to my podcast: https://open.spotify.com/show/5Nn7MhTB9HJSyQ0C6bMKXI
— — — — — — — — —
💰 FREE RESOURCES 💰
— — — — — — — — —
🛠 TOOLS OF THE TRADE 🛠
Software I use (TC2000): https://bit.ly/2HBdnBm
— — — — — — — — —
📱 FOLLOW SHAREPLANNER ON SOCIAL MEDIA 📱
*Disclaimer: Ryan Mallory is not a financial adviser and this podcast is for entertainment purposes only. Consult your financial adviser before making any decisions.
You Might Like

Stop Trying to Hit Home Runs: Start Trading Within Your Means

How to Trade Breakouts Without Getting Trapped

Managing Headline Risk: How to Survive the News Cycle Without Losing Your Mind