
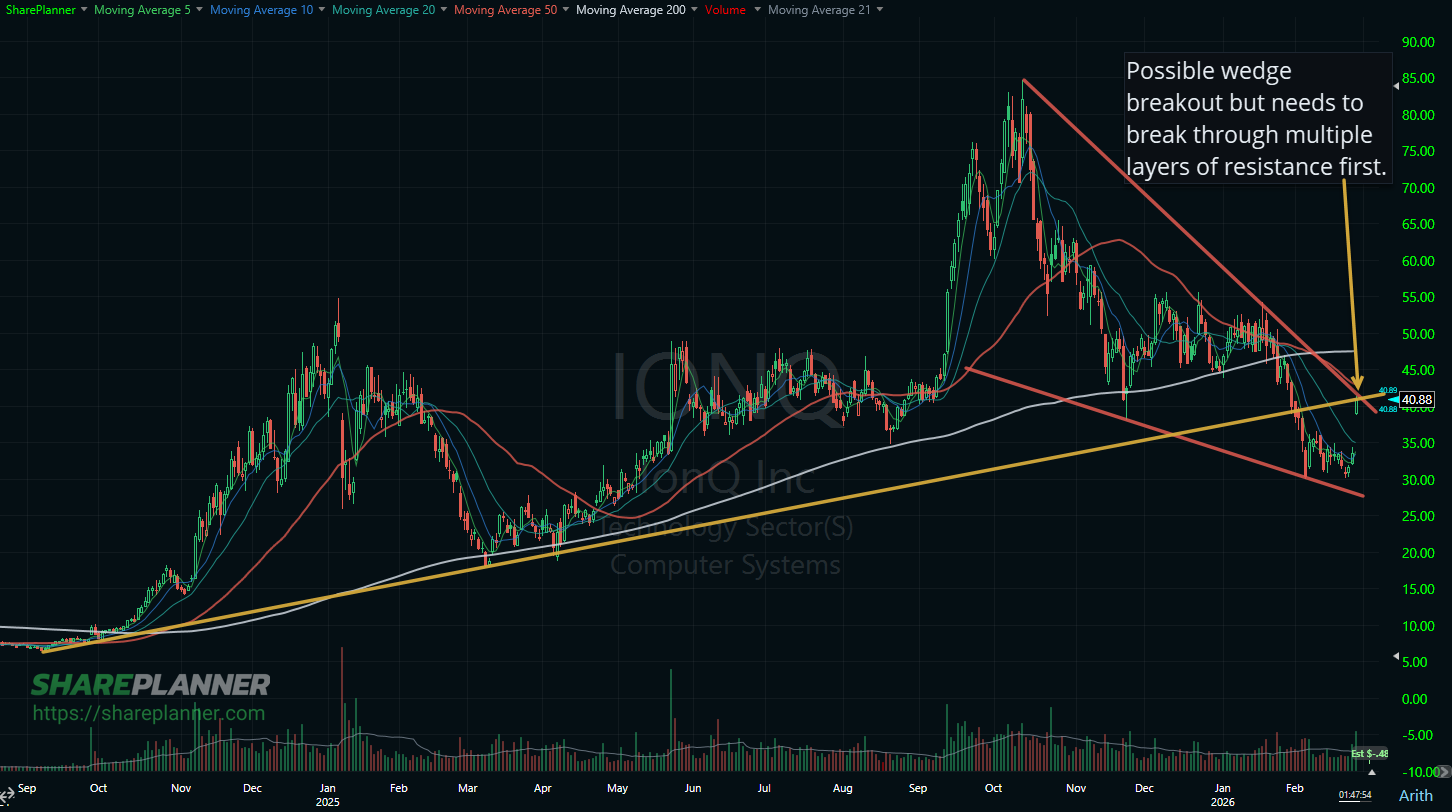
IonQ (IONQ) has been quietly building a trade setup that deserves your attention right now. A wedge pattern is forming on the chart, price is testing it for a potential breakout, and volume is showing signs of conviction. On paper, that’s the kind of setup that gets traders excited.
But there’s a catch. Actually, there are a few.
Before you hit the buy button, there are two significant technical barriers that price still needs to resolve, and one very uncomfortable stop-loss situation that makes sizing into this trade a serious consideration. Let’s walk through all of it.
The Wedge Pattern Taking Shape on IONQ
A wedge pattern forms when price action narrows between two converging trendlines. In the case of IONQ right now, price is pressing up against the upper boundary of the wedge and testing the potential breakout zone.
Now, a wedge pattern is confirmed when price breaks through the lower support trendline, but in breakout setups, traders are watching for price to push convincingly through the resistance side with strong volume behind it. That’s the scenario playing out here on IONQ.
The volume picture is actually the most encouraging part of this setup. Good volume at a breakout point matters a lot, as it can provide the conviction needed for the move in price.
Right now, that volume looks like it’s building on IONQ.
That’s the good news. Here’s where it gets more complicated.
Two Technical Barriers Standing in the Way
Even with a promising wedge pattern and healthy volume, IONQ price has two meaningful overhead obstacles it needs to push through before this breakout can be taken seriously.
The Broken Trendline Retest
The first issue is a previously broken trendline that price is now retesting from underneath. When a trendline gets broken, the roles often reverse. What was once support tends to act as resistance on the way back up. Price rallied from below, came back up to touch that broken trendline, and now that level is pushing back.
This is a classic break-and-retest situation, and it’s one that trips up a lot of traders. They see a wedge forming and volume building, and they jump in without acknowledging that the underside of a broken trendline sitting right overhead is a legitimate reason for price to stall or reject. IONQ needs to close above that level convincingly, not just poke through it intraday.
The 50-Day Moving Average as Dynamic Resistance
The second obstacle is the 50-day moving average sitting right in the same area. This isn’t a coincidence that makes the setup stronger. It’s a problem that makes the resistance cluster more significant.
The 50-day SMA can act as will act as a major moving average support as well as with resistance in a downtrend. When price is trading below the 50-day and trying to push back through it, that average has a tendency to reject the attempt, especially when selling pressure exists.
Two layers of resistance, sitting on top of each other, at the exact point where this wedge breakout needs to happen. That’s not a reason to avoid the trade entirely, but it is absolutely a reason to wait for clear confirmation before entering.
The Stop-Loss Problem: 25% Is Too Much Risk
Here is the issue that I keep coming back to when I look at this chart. Even if you like the setup and believe volume can push price through those resistance levels, the stop-loss placement creates a real problem.
Placing the stop at the key trade support level below the wedge structure puts it roughly 25% away from the current entry area. That is way too much risk for a swing trade.
I’ve written about this before. Stop-losses need to be placed below meaningful support, not at arbitrary percentages. But when the meaningful support level happens to be 25% away, that tells you something important about the risk profile of the trade. A 25% stop on a position is the kind of loss that can damage a portfolio significantly and make recovery that much harder.
So what do you do with that information? A few things worth considering:
- Wait for price to move higher and establish a new, closer area of support before entering
- You can reduce position size dramatically to keep the dollar risk manageable even if the percentage stop is wide, but you’re still in need of a 50% move then just to justify a 2:1 reward/risk ratio.
- If you still want to get long on IONQ, stay patient and watch for price to break above the 50-day and the broken trendline before committing any capital at all
That last option is the most conservative but also the most disciplined approach. Let the chart prove itself first. A confirmed breakout above both resistance levels, on strong volume, with a tighter risk structure, gives you a far better trade than jumping in early and hoping for the best.
What Needs to Happen for This Trade to Work
To summarize where IONQ stands right now and what would shift the risk profile favorably:
- Price needs to close convincingly above the broken trendline on the underside retest
- The 50-day moving average needs to flip from resistance to support, with price holding above it
- Volume needs to stay strong through the breakout attempt, not fade as price moves higher
- A closer stop-loss opportunity needs to present itself as the setup develops
If all four of those things fall into place, IONQ becomes a very interesting trade. Right now, it’s a setup worth monitoring closely, not one worth sizing into heavily.
Patience Is the Edge Here
The wedge on IONQ is real. The volume is encouraging. But the broken trendline retest, the 50-day moving average acting as resistance, and the wide stop-loss requirement are all legitimate reasons to stay disciplined.
Good traders don’t just identify setups. They wait for the right conditions before committing capital. Trade what you see on the chart, not what you want the chart to do. Right now, IONQ is showing you the potential. Let it show you the confirmation before you act.
If you want to stay on top of IONQ and setups like this as they develop in real time, join the Trading Block where I share my trades, analysis, and live market commentary with traders every day. You get a free 7-day trial, so there’s nothing to lose by checking it out.
Frequently Asked Questions About IONQ Technical Analysis
What is a wedge pattern in technical analysis?
A wedge pattern forms when price compresses between two converging trendlines. It often signals a potential breakout once price clears resistance with strong volume.
Why is the 50-day moving average important for IONQ?
The 50-day moving average often acts as dynamic resistance in downtrends. A breakout above it with conviction can signal a shift in momentum.
What does a broken trendline retest mean?
When a trendline breaks, it often flips roles. Previous support can become resistance. Price must reclaim that level convincingly for a bullish case to strengthen.
Is a 25% stop-loss too wide for a swing trade?
For most swing traders, a 25% stop creates excessive risk relative to potential reward. Position sizing and risk structure must be considered carefully.
What confirmation should traders wait for on IONQ?
Traders typically look for a strong close above resistance, sustained volume, and a tighter support structure before committing capital.


Welcome to Swing Trading the Stock Market Podcast!
I want you to become a better trader, and you know what? You absolutely can!
Commit these three rules to memory and to your trading:
#1: Manage the RISK ALWAYS!
#2: Keep the Losses Small
#3: Do #1 & #2 and the profits will take care of themselves.
That’s right, successful swing-trading is about managing the risk, and with Swing Trading the Stock Market podcast, I encourage you to email me (ryan@shareplanner.com) your questions, and there’s a good chance I’ll make a future podcast out of your stock market related question.
Watching the dollars rise and fall in your trading account can turn a well-planned swing trade into an emotional, deeply personal decision. In this episode, I explain why focusing on price action, percentage returns, and R-multiples can help you avoid cutting winners early, holding losers too long, and abandoning your trading plan.
Be sure to check out my Swing-Trading offering through SharePlanner that goes hand-in-hand with my podcast, offering all of the research, charts and technical analysis on the stock market and individual stocks, not to mention my personal watch-lists, reviews and regular updates on the most popular stocks, including the all-important big tech stocks. Check it out now at: https://www.shareplanner.com/premium-plans
📈 START SWING-TRADING WITH ME! 📈
Click here to subscribe: https://shareplanner.com/tradingblock
— — — — — — — — —
💻 STOCK MARKET TRAINING COURSES 💻
Click here for all of my training courses: https://www.shareplanner.com/trading-academy
– The A-Z of the Self-Made Trader –https://www.shareplanner.com/the-a-z-of-the-self-made-trader
– The Winning Watch-List — https://www.shareplanner.com/winning-watchlist
– Patterns to Profits — https://www.shareplanner.com/patterns-to-profits
– Get 1-on-1 Coaching — https://www.shareplanner.com/coaching
— — — — — — — — —
❤️ SUBSCRIBE TO MY YOUTUBE CHANNEL 📺
Click here to subscribe: https://www.youtube.com/shareplanner?sub_confirmation=1
🎧 LISTEN TO MY PODCAST 🎵
Click here to listen to my podcast: https://open.spotify.com/show/5Nn7MhTB9HJSyQ0C6bMKXI
— — — — — — — — —
💰 FREE RESOURCES 💰
— — — — — — — — —
🛠 TOOLS OF THE TRADE 🛠
Software I use (TC2000): https://bit.ly/2HBdnBm
— — — — — — — — —
📱 FOLLOW SHAREPLANNER ON SOCIAL MEDIA 📱
*Disclaimer: Ryan Mallory is not a financial adviser and this podcast is for entertainment purposes only. Consult your financial adviser before making any decisions.

You Might Like

South Korea: The Hidden Driver of US Tech Volatility

Stop Trying to Hit Home Runs: Start Trading Within Your Means

How to Trade Breakouts Without Getting Trapped