

$ASTX 8 Day Chart - I like this setup, I would love to see it re-testing the 4.58 fib level, and once it crosses back above the 20ma, I think it takes off. $BBRY Daily Chart - Close to the 15.52 Fib level, I think this time it goes. If it doesn't then use 15.52
I hope everyone had a great time this 3 day weekend with family and friends. So the $SPY closed on it's all time highs last Thursday. Again above my personal target of 156.45. This morning we are looking to make new highs. This morning we have The Institute for Supply Management will release the March

$AMRN Daily Chart - This is my kind of setup, scooping from the bottom up. As long as it holds the 7.53 level, it is an awesome long setup. $BBRY 2 day chart - Weak bounce as usual, I don't even know why it shows up so much on my screner. Above 15.52 is good,
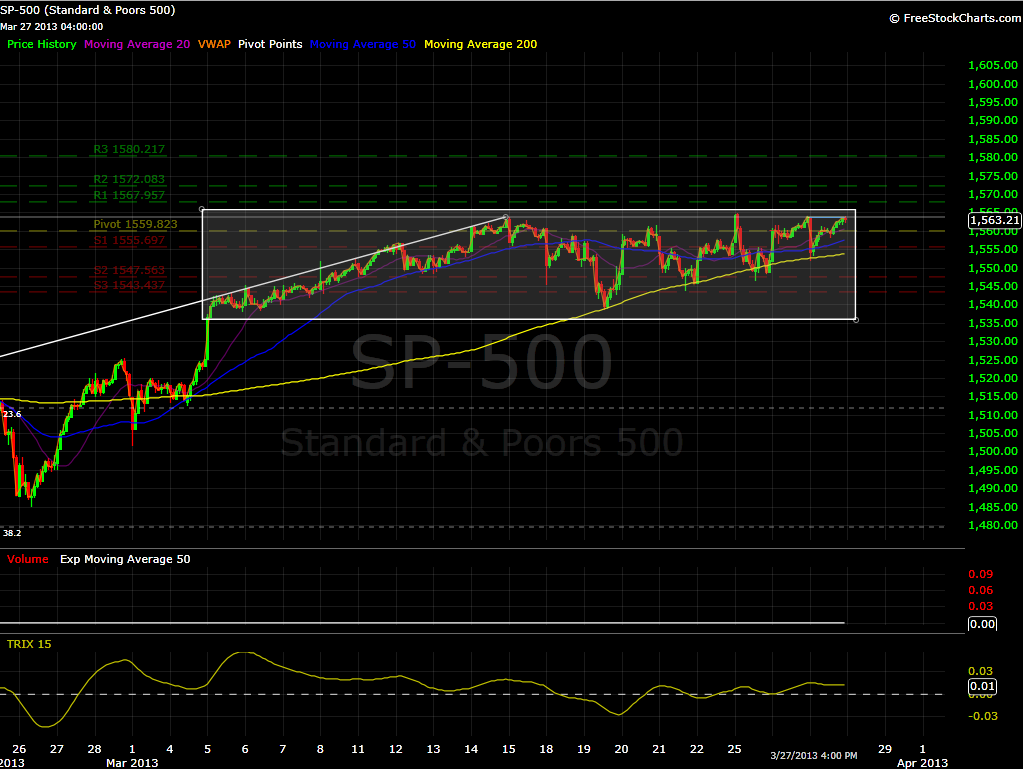
The theme continues to be the same for almost one month. We seem to be doing the longest inside trading day ever. Ever since we gaped up on March 5 and topped out we have been moving sideways ever since Will we finally break out of this range today and reach new highs? Or will

$AAPL Daily Chart - This is a Fibonacci study focused on short term trading on $AAPL. It held the 451.42 which represents the 23.6% Fibonacci level on this particula chart. As long as it stays above this level it is a good long. First target 471.26. $BBRY Daily Chart - Posted nice earnings, but 15.52
So much excitement yesterday, so much talk about making new highs. And now we are back to reality. How confident does these headlines make you feel? "Cyprus Banks Opening: Guards Prepare for Battle" or "Europe Shares Turn Lower on Italy Concerns". The only thing that can save the day is the Home Pending Data coming in

$AIXG Daily Chart - Gaping but low volume. If it touches 15.35, and does not cross it, it could be a nice 1 dollar roll short. $BSFT 2 Hour Chart - Same thing gaping, but not that much. I want to see how it will handle the lower Fibonacci Support @ 27.72. $CETV Hourly Chart
European shares are mildly holding their gains as Cyprus fears continue. Some banks were to be reopened today, but he government decided that they should stay closed until Thursday. The $SPY is mildly higher, but not convincing. Most of the setups I see are bearish, as the market is again trying to find a reason

$ARMH 2 Hour Chart - Seems to be holding well the 41 level. Gaping higher today. The gap still puts the stock in the middle of two Fibonacci Levels. $ARNA Daily Chart - Mild gap but put it very close to yesterday's highs. Could be a runner today. $BBRY Daily Chart - Talk about a

spc@shareplanner.com
(904) 800-8420
© Copyright 2025 | SharePlanner Inc. All Rights Reserved.
Disclaimer: The information provided on this website is for educational and informational purposes only. Ryan Mallory and/or SharePlanner are not licensed financial advisors, brokers, or tax professionals. The content on this site should not be considered as financial, investment, tax, or legal advice.
All information and opinions expressed herein are based on sources believed to be accurate and reliable. However, we make no representation or warranty as to their accuracy, completeness, or reliability. Any action you take upon the information on this website is strictly at your own risk.
Past performance is not indicative of future results. Investing involves risk, including the possible loss of principal. All investors should make their own decisions based on their specific investment objectives and financial circumstances.
This site may contain links to external websites that are not provided or maintained by or in any way affiliated with Ryan Mallory and/or SharePlanner. Please note that Ryan Mallory and/or SharePlanner do not guarantee the accuracy, relevance, timeliness, or completeness of any information on these external websites.
By using this website, you agree that Ryan Mallory and/or SharePlanner and any affiliated parties are not responsible for any losses or damages resulting from your use of or reliance on the information provided.
It is strongly recommended that you consult with a qualified professional before making any financial decisions.