
There are times when you simply shouldn't be trading at all. What are those times and why are they so bad for your stock trading as a whole. In this podcast episode I talk about my experiences in swing-trading and day-trading and why you should avoid the stock market entirely when you are not your
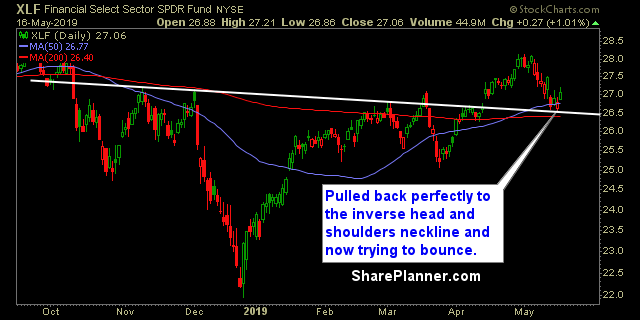
A number of head and shoulders patterns trying to form. Technology is not currently in the top three, but it is certainly the fourth best sector which places it right in the middle of the pack for now. The market has had a couple of weeks of late that has not been very easy for

There are times when you simply shouldn't be trading at all. What are those times and why are they so bad for your trading as a whole. In this podcast episode I talk about my experiences in trading and some of the more stressful times in my trading.

The stock market is selling off hard and fast this week, and we are seeing volatility levels that haven't been seen since Q4 of last year when the market pulled back over 20%. Is now the time to be scared? Should you be selling your stocks? How do you get through such a difficult period?
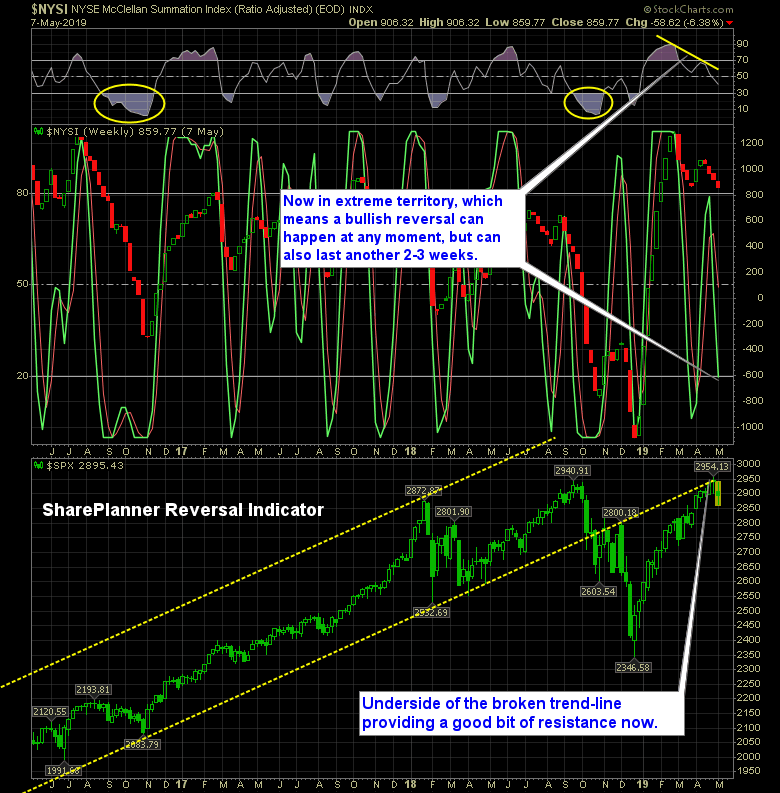
Indicator is bearish, but may have signs of hope. Last time I published this indicator, I mentioned how there was a bearish divergence forming, and it turned out to foreshadow what we have seen this week. The frustrating part for me was that I actually had a short position on SPX and the darn
The FOMC Statement that is released every six weeks by the Federal Reserve. It represents one of the most volatile periods of the stock market on an intraday basis. Their decisions they make, carries a huge impact not only the day of the statement, but in anticipation of and in the days that follow. So

Information received since the Federal Open Market Committee met in March indicates that the labor market remains strong and that economic activity rose at a solid rate. Job gains have been solid, on average, in recent months, and the unemployment rate has remained low. Growth of household spending and business fixed investment slowed in the
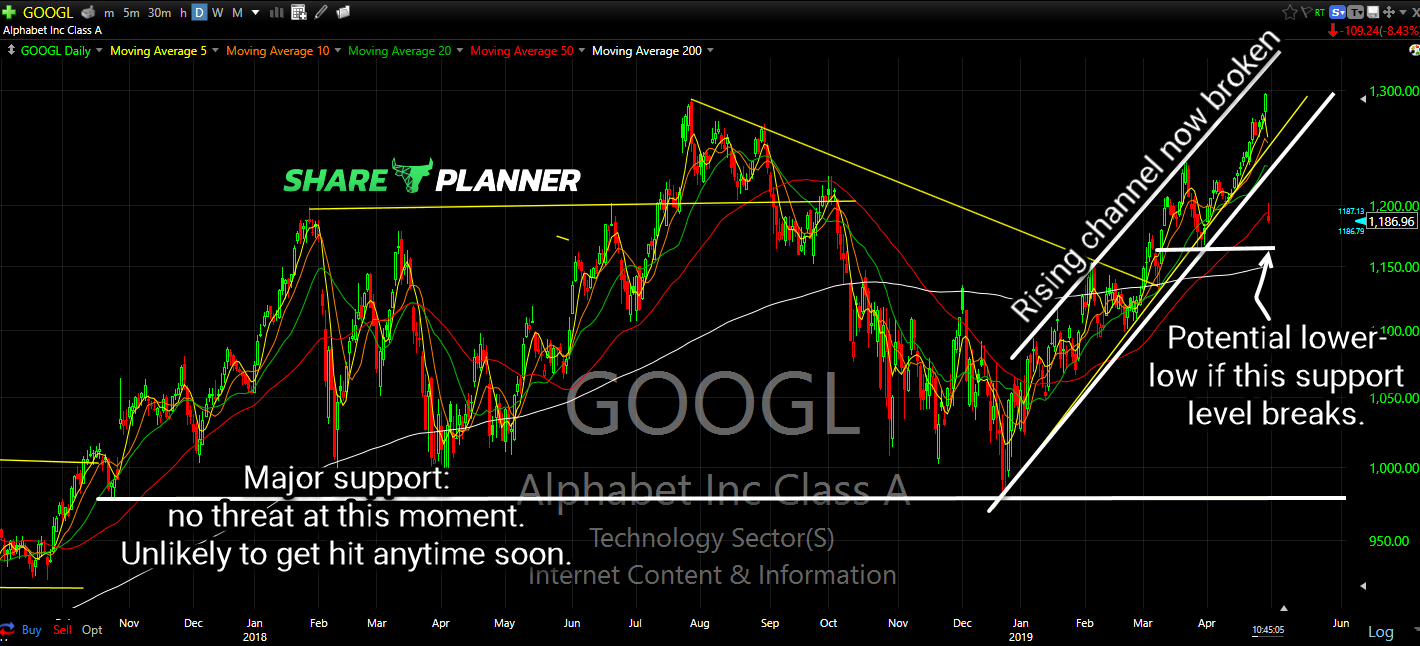
Google (GOOG) is getting flat out bushwhacked today, following yesterday afternoon's earnings report. If you bought calls or stock straight up, it is a blood bath for you (again, this is a perfect example of why you don't hold trades through earnings). So where does it go from here? Well, check out my chart and

Earnings season is the toughest and most difficult time in the stock market for traders and investors alike. There are so many companies reporting earnings, and so many of them that miss analyst estimates or cut guidance that it creates a huge loss for the trader holding the stock. In my video, I am going
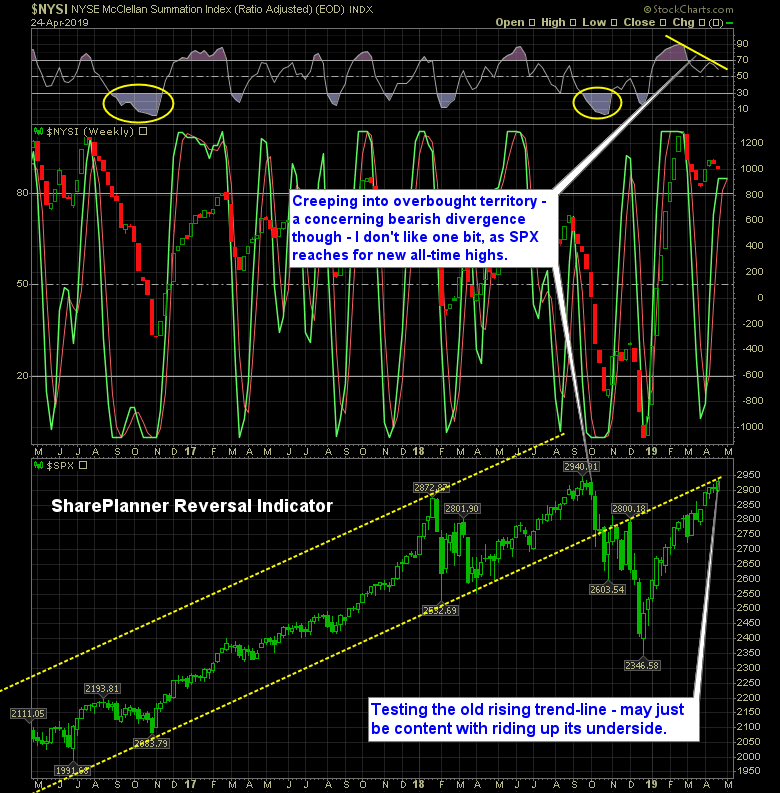
The Reversal Indicator could break lower, as a major divergence pops up. Notice that RSI divergence at the top of the chart? Not the best look for this market that is struggling to sustain momentum. I still think you still have to remain bullish on this market, but a hedge wouldn’t hurt here, for sure.

spc@shareplanner.com
(904) 800-8420
© Copyright 2025 | SharePlanner Inc. All Rights Reserved.
Disclaimer: The information provided on this website is for educational and informational purposes only. Ryan Mallory and/or SharePlanner are not licensed financial advisors, brokers, or tax professionals. The content on this site should not be considered as financial, investment, tax, or legal advice.
All information and opinions expressed herein are based on sources believed to be accurate and reliable. However, we make no representation or warranty as to their accuracy, completeness, or reliability. Any action you take upon the information on this website is strictly at your own risk.
Past performance is not indicative of future results. Investing involves risk, including the possible loss of principal. All investors should make their own decisions based on their specific investment objectives and financial circumstances.
This site may contain links to external websites that are not provided or maintained by or in any way affiliated with Ryan Mallory and/or SharePlanner. Please note that Ryan Mallory and/or SharePlanner do not guarantee the accuracy, relevance, timeliness, or completeness of any information on these external websites.
By using this website, you agree that Ryan Mallory and/or SharePlanner and any affiliated parties are not responsible for any losses or damages resulting from your use of or reliance on the information provided.
It is strongly recommended that you consult with a qualified professional before making any financial decisions.