
Technical Outlook: Following the FOMC statement yesterday, in which they did not raise rates, SPX managed to rally over 1.1% to close at 2090 and at new rally highs. Market now setup for a possible test of all-time highs, when less then a month ago it was trading at 1871. Kind of insane really. Despite

Technical Outlook: SPX 2079-80 offering some resistance with price consolidating just underneath. Support for now appears to remain solid above the 200-day moving average. Opening/Closing prices of the past two trading sessions continue to remain tightly bound to each other. Volume was extremely light on SPY yesterday, and well under half of what we
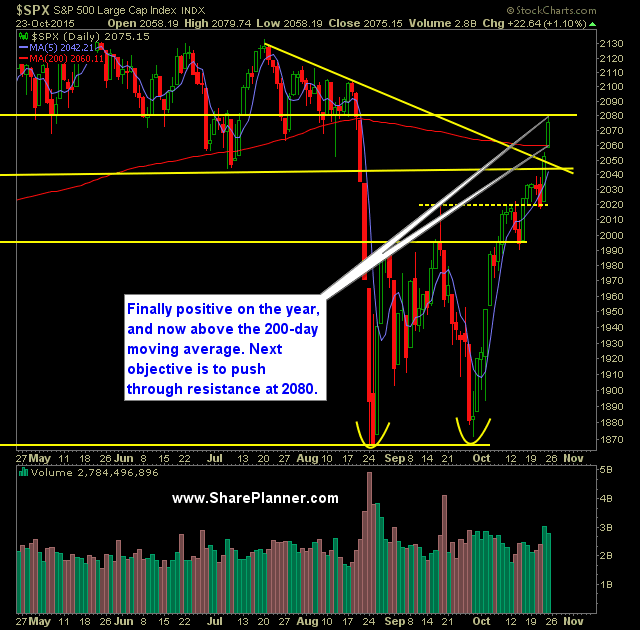
Technical Outlook: Huge rally again for a second day in a row, sending SPX up 56 points over that two-day stretch. Friday’s rally saw SPX get back into positive territory for the year. The 200-day moving average of SPX has now been broken. The rally was far from anything being broad-based. In fact the advancers

Technical Outlook: Huge move yesterday after SPX broke above key resistance and back trading range from February through March. Today's gap up will put the market back into positive trading territory for the first time since 8/20/15. 2080 - a support/resistance level that has been tested multiple times in the past and proved itself to

Technical Outlook: Choppy trading session yesterday that saw price action crumble in the final hour of trading. Price action on SPX is once again testing the 10-day moving average. This was tested twice last week and resulted in a strong bounce. SPX continues to struggle with downward resistance off of the July highs at 2039.

Technical Outlook: Quiet day of trading yesterday as SPX consolidated for a second straight day. Slight uptick in volume from the day prior but once again extremely low overall. SPY just a shade below major resistance at $204.11, which represents the underside of the February through August trading range of this year. SPX testing

Technical Outlook: Despite weakness early, dip buyers came in and rallied the market back to break even with a last minute spike in the trading session to put the market in positive territory. Essentially there are three resistance levels to watch: 1) Lower channel, range resistance at 2040 as shown below, 2) Declining resistance off

Technical Outlook: Strong follow through on Friday that put the SPX at new rally highs and setting up for a test of key resistance beginning at 2040. This represents the bottom end of the range that SPX had been stuck in going back to March through August of this year. On the weekly SPX chart,

Technical Outlook: SPX managed to breakout above Tuesday’s intraday highs, and more importantly managed to close above 2020 again after a two-day pullback that threatened to rollover the market. Volume rose for the third straight day and almost was at recent average levels. SPX now poised to challenge the 200-day moving average in the
-
Technical Outlook: Yesterday marked the second day of selling for SPX, pulling back to the 50 day moving average which it managed to test and hold. SPX pulled back to the breakout level of the double bottom yesterday. In order to jump-start the next leg up for the market, SPX is going to need to

spc@shareplanner.com
(904) 800-8420
© Copyright 2025 | SharePlanner Inc. All Rights Reserved.
Disclaimer: The information provided on this website is for educational and informational purposes only. Ryan Mallory and/or SharePlanner are not licensed financial advisors, brokers, or tax professionals. The content on this site should not be considered as financial, investment, tax, or legal advice.
All information and opinions expressed herein are based on sources believed to be accurate and reliable. However, we make no representation or warranty as to their accuracy, completeness, or reliability. Any action you take upon the information on this website is strictly at your own risk.
Past performance is not indicative of future results. Investing involves risk, including the possible loss of principal. All investors should make their own decisions based on their specific investment objectives and financial circumstances.
This site may contain links to external websites that are not provided or maintained by or in any way affiliated with Ryan Mallory and/or SharePlanner. Please note that Ryan Mallory and/or SharePlanner do not guarantee the accuracy, relevance, timeliness, or completeness of any information on these external websites.
By using this website, you agree that Ryan Mallory and/or SharePlanner and any affiliated parties are not responsible for any losses or damages resulting from your use of or reliance on the information provided.
It is strongly recommended that you consult with a qualified professional before making any financial decisions.