
SharePlanner Reversal Indicator still showing mixed signals on multiple time frames.
I hate it on the rare occasions that this happens, but I think it is a testament to the current market conditions, where inside of an already tight trading range, you have a two month long triangle pattern that is narrowing the range even further.
I honestly do not think that in the time I have been publishing the SharePlanner Reversal Indicator that there has ever been early reversals on both time frames going in opposite directions. How does that even happen!?!
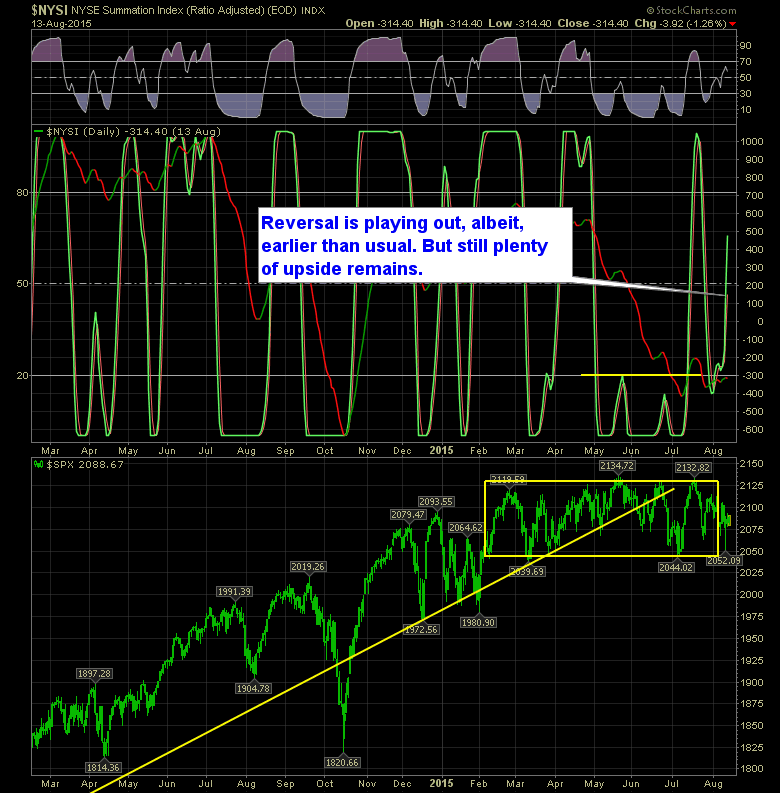
Nonetheless, on the Daily chart, you have a nice reversal well in place with what appears to be, still plenty of room to run higher. At this point, I’d be shocked to see another early reversal back to the downside.
Here is the Daily SPRI:
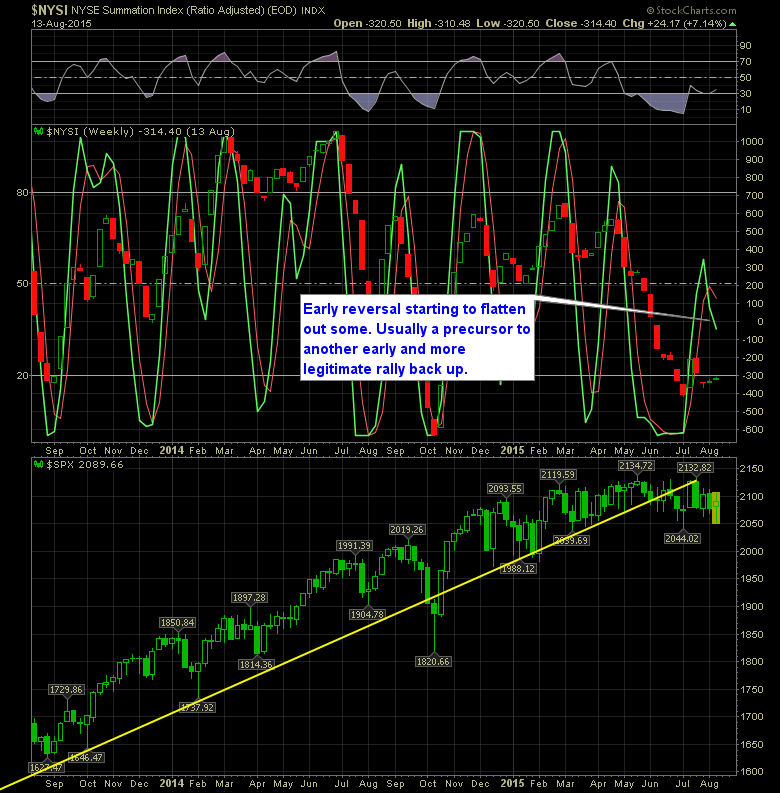
On the weekly SPRI, I am still somewhat skeptical of what is unfolding here. The early reversal is just underway, but is already showing signs of flat-lining here and that is against an early reversal on the daily chart that is sky-rocketing higher unabated.
Here is the Weekly SPRI:
Overall, I think anything is possible in the current trading environment. The bears are close to having the bulls against the ropes and we almost saw a knockout punch this week had it not been for the afternoon arrival of the dip buyers who managed to rally SPX +30 points off of the lows. On the bull’s side of things, they are only a couple of percentage points away from breaking this market out to new all time highs and out of this 6-month long range. So remain nimble and prepare for anything.


Welcome to Swing Trading the Stock Market Podcast!
I want you to become a better trader, and you know what? You absolutely can!
Commit these three rules to memory and to your trading:
#1: Manage the RISK ALWAYS!
#2: Keep the Losses Small
#3: Do #1 & #2 and the profits will take care of themselves.
That’s right, successful swing-trading is about managing the risk, and with Swing Trading the Stock Market podcast, I encourage you to email me (ryan@shareplanner.com) your questions, and there’s a good chance I’ll make a future podcast out of your stock market related question.
Watching the dollars rise and fall in your trading account can turn a well-planned swing trade into an emotional, deeply personal decision. In this episode, I explain why focusing on price action, percentage returns, and R-multiples can help you avoid cutting winners early, holding losers too long, and abandoning your trading plan.
Be sure to check out my Swing-Trading offering through SharePlanner that goes hand-in-hand with my podcast, offering all of the research, charts and technical analysis on the stock market and individual stocks, not to mention my personal watch-lists, reviews and regular updates on the most popular stocks, including the all-important big tech stocks. Check it out now at: https://www.shareplanner.com/premium-plans
📈 START SWING-TRADING WITH ME! 📈
Click here to subscribe: https://shareplanner.com/tradingblock
— — — — — — — — —
💻 STOCK MARKET TRAINING COURSES 💻
Click here for all of my training courses: https://www.shareplanner.com/trading-academy
– The A-Z of the Self-Made Trader –https://www.shareplanner.com/the-a-z-of-the-self-made-trader
– The Winning Watch-List — https://www.shareplanner.com/winning-watchlist
– Patterns to Profits — https://www.shareplanner.com/patterns-to-profits
– Get 1-on-1 Coaching — https://www.shareplanner.com/coaching
— — — — — — — — —
❤️ SUBSCRIBE TO MY YOUTUBE CHANNEL 📺
Click here to subscribe: https://www.youtube.com/shareplanner?sub_confirmation=1
🎧 LISTEN TO MY PODCAST 🎵
Click here to listen to my podcast: https://open.spotify.com/show/5Nn7MhTB9HJSyQ0C6bMKXI
— — — — — — — — —
💰 FREE RESOURCES 💰
— — — — — — — — —
🛠 TOOLS OF THE TRADE 🛠
Software I use (TC2000): https://bit.ly/2HBdnBm
— — — — — — — — —
📱 FOLLOW SHAREPLANNER ON SOCIAL MEDIA 📱
*Disclaimer: Ryan Mallory is not a financial adviser and this podcast is for entertainment purposes only. Consult your financial adviser before making any decisions.

You Might Like

South Korea: The Hidden Driver of US Tech Volatility

Stop Trying to Hit Home Runs: Start Trading Within Your Means

How to Trade Breakouts Without Getting Trapped