
If you recall last week, I was really struggling to get a handle on a legitimate interpretation on the SharePlanner Reversal Indicator and trying to reconcile the daily and weekly chart. However, this week provides us with a much clearer picture, and based on what we are seeing the two time periods are finally starting

Pre-market update: Asian markets traded 0.5% higher. European markets are trading flat. US futures are trading 0.2% higher ahead of the market open. Economic reports due out (all times are eastern): International Trade (8:30), Jobless Claims (8:30), PMI Manufacturing Index Flash (8:58), JOLTS, 10), EIA Natural Gas Report (10:30), Kansas City Fed Manufacturing Index (11) Technical
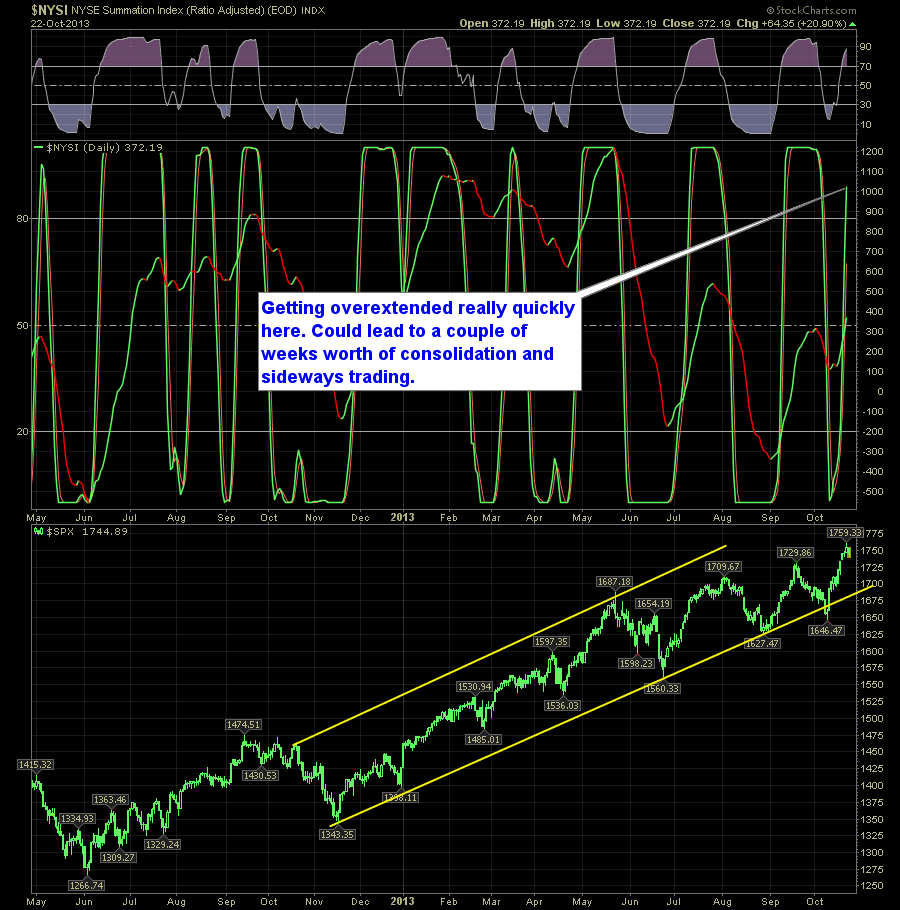
Some interesting changes taking place on the SharePlanner Reversal Indicator. First, you have the daily getting a little overheated. Not to the extremes yet that we are used to seeing reversals take place at, but still enough to keep a close eye on it. The weekly has also changed on us with an in-route
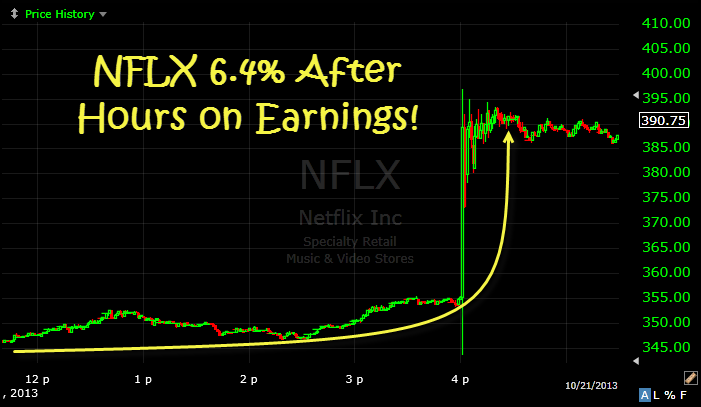
Netflix proves there is always something left in the gas tank… SharePlanner Market Compass: Too much for this rally to handle… I suspect we need at least a 10 point pullback. Quick Glance at the Market Heat Map and Industries Notables: A lot more weakness than the market led us to believe today. Lots of
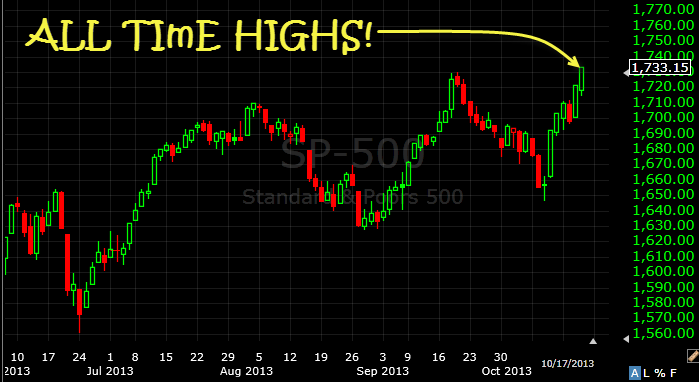
Oh No!!! That Shutodown was quite the drag on the markets… SharePlanner Market Compass: I don’t even need to explain myself here. Quick Glance at the Market Heat Map and Industries Notables: Financials calmed down some, mainly because of GS, but were still solid overall. Tech Bigs struggled. Utilities and Consumer Goods rocked. Be
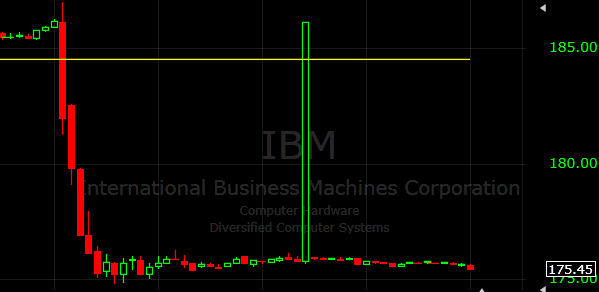
IBM gets hammered after hours… SharePlanner Market Compass: Told ‘ya the uptrend remained intact. Quick Glance at the Market Heat Map and Industries Notables: Financials were en fuego! Tech not as strong as I would’ve liked. Nor was materials. Healthcare had some power to its punch today. Be sure to check out my latest swing
A look at how spending is still out of hand in one area – a war that is suppose to be coming to a close: Afghanistan war… SharePlanner Market Compass: Stay calm….uptrend still intact. Quick Glance at the Market Heat Map and Industries Notables: Utilities took a beating Banking was right behind them. Technology had
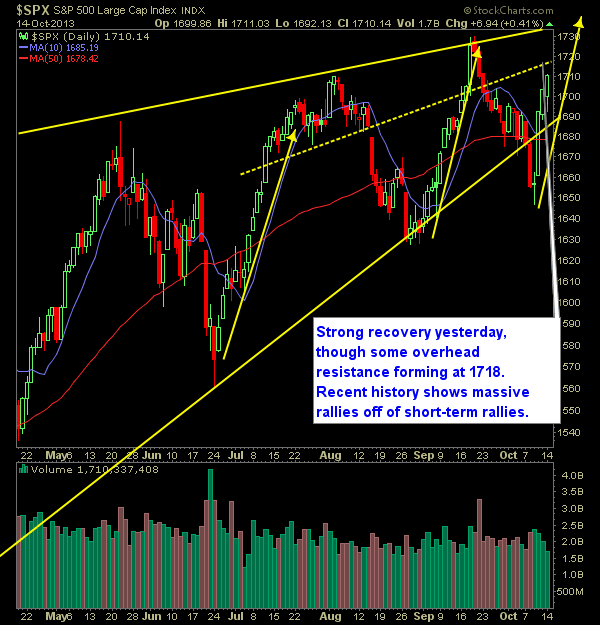
Pre-market update: Asian markets traded 0.6% higher. European markets are trading 0.8% higher. US futures are trading flat ahead of the market open. Economic reports due out (all times are eastern): ICSC-Goldman Store Sales (7:45), Empire State Manufacturing Survey (8:30), Redbook (8:55) Technical Outlook (SPX): Despite a significant gap down in the SPX and indices across
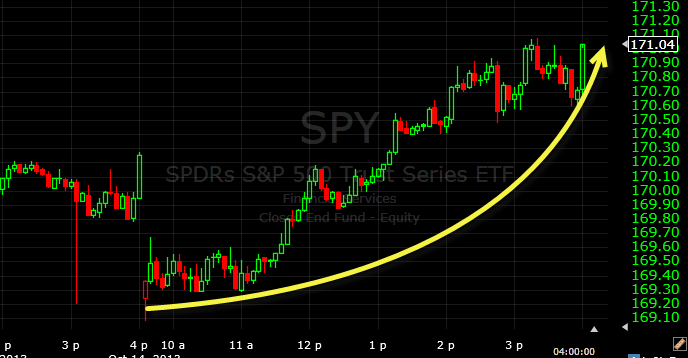
Another buy-the-dip kinda day… SharePlanner Market Compass: Not seeing any reason why the uptrend should be doubted at t his point. Quick Glance at the Market Heat Map and Industries Notables: Utilities saw a flight out of this safety industry. A good sign for stocks. Basic Materials showed moderate strength. Telecon had problems. Be sure
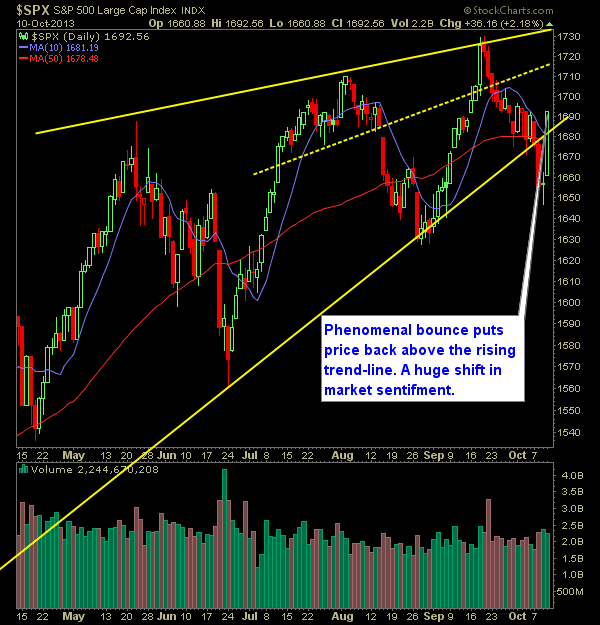
Pre-market update: Asian markets traded 1.4% higher. European markets are trading 0.3% higher. US futures are trading 0.1% lower ahead of the market open. Economic reports due out (all times are eastern): Producer Price Index (8:30), Retail Sales (8:30), Consumer Sentiment (9:55), Business Inventories (10) Technical Outlook (SPX): Insane market bounce that was the biggest trading

spc@shareplanner.com
(904) 800-8420
© Copyright 2025 | SharePlanner Inc. All Rights Reserved.
Disclaimer: The information provided on this website is for educational and informational purposes only. Ryan Mallory and/or SharePlanner are not licensed financial advisors, brokers, or tax professionals. The content on this site should not be considered as financial, investment, tax, or legal advice.
All information and opinions expressed herein are based on sources believed to be accurate and reliable. However, we make no representation or warranty as to their accuracy, completeness, or reliability. Any action you take upon the information on this website is strictly at your own risk.
Past performance is not indicative of future results. Investing involves risk, including the possible loss of principal. All investors should make their own decisions based on their specific investment objectives and financial circumstances.
This site may contain links to external websites that are not provided or maintained by or in any way affiliated with Ryan Mallory and/or SharePlanner. Please note that Ryan Mallory and/or SharePlanner do not guarantee the accuracy, relevance, timeliness, or completeness of any information on these external websites.
By using this website, you agree that Ryan Mallory and/or SharePlanner and any affiliated parties are not responsible for any losses or damages resulting from your use of or reliance on the information provided.
It is strongly recommended that you consult with a qualified professional before making any financial decisions.