
Some people haven’t quite shared the same sentiment about the current pattern developing on the S&P 500 (SPX) as me. Granted, it is tough to make out on the daily chart, but I’ve gone ahead and drilled down to the 30 minute chart to show you the head and shoulders pattern the market is on the verge of confirming right now. ![]()
Remember the right shoulder of a head and shoulders pattern does not have to be symmetrical with the left shoulder. Rarely is it, as it usually is much small and a bit deformed.
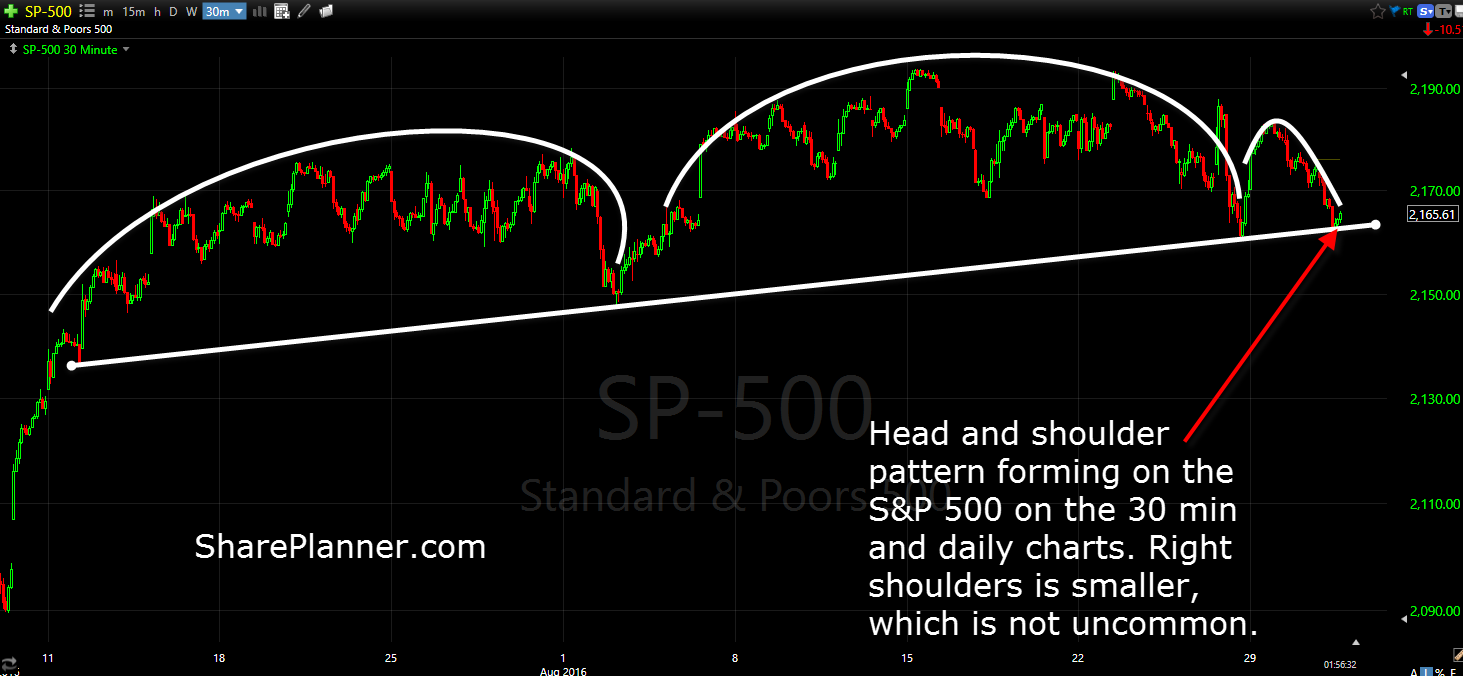
I don’t know if it will confirm or not, as the dip buyers are still trying to prop up the market early on in the afternoon. But it is worth watching. If you don’t think that the chart I’ve drawn qualifies as a head and shoulders pattern, that is your prerogative, but one can’t deny the massive support level that is in place, which I drew as well (the H&S neckline).
Either way, if that support level gives, it should bring on additional selling for the market as a whole.


Welcome to Swing Trading the Stock Market Podcast!
I want you to become a better trader, and you know what? You absolutely can!
Commit these three rules to memory and to your trading:
#1: Manage the RISK ALWAYS!
#2: Keep the Losses Small
#3: Do #1 & #2 and the profits will take care of themselves.
That’s right, successful swing-trading is about managing the risk, and with Swing Trading the Stock Market podcast, I encourage you to email me (ryan@shareplanner.com) your questions, and there’s a good chance I’ll make a future podcast out of your stock market related question.
Passive investing can be a great source of funds for retirement and for building a nest egg. In this podcast episode, a husband and wife asks Ryan's thoughts on building a SPY position on just $2/day. While consistent building a nest egg, is great, the timing and strategy in doing so is just as important.
Be sure to check out my Swing-Trading offering through SharePlanner that goes hand-in-hand with my podcast, offering all of the research, charts and technical analysis on the stock market and individual stocks, not to mention my personal watch-lists, reviews and regular updates on the most popular stocks, including the all-important big tech stocks. Check it out now at: https://www.shareplanner.com/premium-plans
📈 START SWING-TRADING WITH ME! 📈
Click here to subscribe: https://shareplanner.com/tradingblock
— — — — — — — — —
💻 STOCK MARKET TRAINING COURSES 💻
Click here for all of my training courses: https://www.shareplanner.com/trading-academy
– The A-Z of the Self-Made Trader –https://www.shareplanner.com/the-a-z-of-the-self-made-trader
– The Winning Watch-List — https://www.shareplanner.com/winning-watchlist
– Patterns to Profits — https://www.shareplanner.com/patterns-to-profits
– Get 1-on-1 Coaching — https://www.shareplanner.com/coaching
— — — — — — — — —
❤️ SUBSCRIBE TO MY YOUTUBE CHANNEL 📺
Click here to subscribe: https://www.youtube.com/shareplanner?sub_confirmation=1
🎧 LISTEN TO MY PODCAST 🎵
Click here to listen to my podcast: https://open.spotify.com/show/5Nn7MhTB9HJSyQ0C6bMKXI
— — — — — — — — —
💰 FREE RESOURCES 💰
— — — — — — — — —
🛠 TOOLS OF THE TRADE 🛠
Software I use (TC2000): https://bit.ly/2HBdnBm
— — — — — — — — —
📱 FOLLOW SHAREPLANNER ON SOCIAL MEDIA 📱
*Disclaimer: Ryan Mallory is not a financial adviser and this podcast is for entertainment purposes only. Consult your financial adviser before making any decisions.
You Might Like

Stop Trying to Hit Home Runs: Start Trading Within Your Means

How to Trade Breakouts Without Getting Trapped

Managing Headline Risk: How to Survive the News Cycle Without Losing Your Mind