
Economic Reports Due out (Times are EST): FOMC Meeting Begins, ICSC-Goldman Store Sales (7:45am), Housing Starts (8:30am), Redbook (8:55am)
Pre-market Update (Updated 8:00am eastern):
- US futures are slightly higher.
- European markets are trading 0.5% higher.
- Asian markets traded on average -0.4% lower.
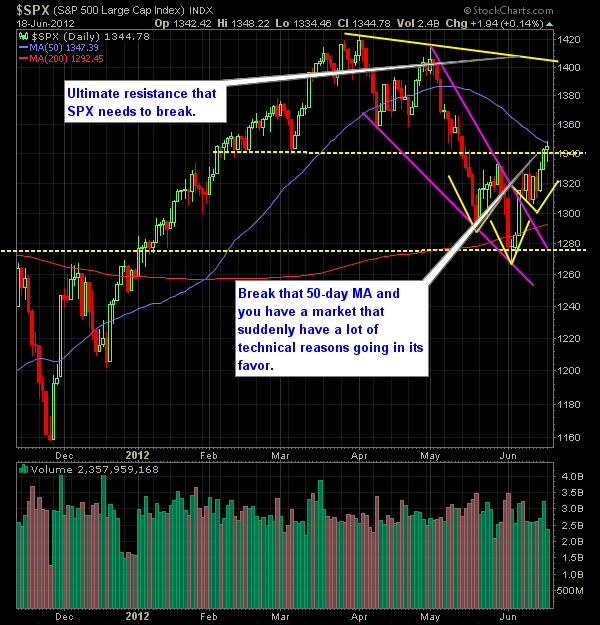
Technical Outlook (SPX):
- Yesterday provided us with sideways price action, with a slight bullish tilt to it.
- 50-day moving average stopped any hopes of a rally – and will be key resistance for today.
- 1346 represents where the moving average will be at today, and where the S&P will need to break through. Today’s slight strength ahead of the bell could see an open above that price level.
- We are right back in overbought territory, but the thing is, if the market is indeed on a strong run, it can stay in this area, for quite a while.
- A healthy sign for the market is that we are just below the upper-band of the Bollinger Bands (not out side of it) and riding the upper band nicely higher now.
- There is now an established uptrend in place on SPX off of the 6/4 lows with consecuitive higher-highs and higher-lows now (two of each).
- FOMC Statement to be issued tomorrow, which could stir up market rumors of QE3 (though I doubt it).
- Quite a ways from current price, but ultimately, if the price can clear 1401 we’ll have a market that is very bullish.
- Represents the slightly descending resistance level off of the 4/2/12 highs.
- SPX confirmed the inverse head and shoulders pattern on Friday.
- Of late, respectable support lies at the 10-day moving average.
- Has touched it multiple times in the past 2 weeks and held each time.
- IH&S pattern very obvious on the 30-minute chart.
- Confirmed on Friday.
- Volume remains relatively average.
- The markets in general have pulled back roughly 10% off of its recent highs which is typically considered a “pullback” in the markets.
- Measured by recent highs to its most recent lows.
- A break below 1306 would represent a resumption of the downward trend.
- The VIX had one of its worst days in a long long time – dropping over 13% and pushing it back below 20 at 18.32. This is a very bullish sign for the market, as fear is starting to leave the markets.
My Opinions & Trades:
- I don’t see, based on the charts, any notable reasons to be short this market.
- I can tell you a million economic/fundamental reasons, but as a chartist, I have to leave personal biases behind, and simplify read the charts.
- With a total of 6 long positions, I may look to push it to 7, but more than likely I would look to switch out non-performers with new ones I believe hold more opportunity to them.
- Careful about trading in and out of this market too much – I’m playing with my original stop-losses which is usually 3-4% off of the entry price and gives me enough wiggle room to weather the choppiness of this market day-to-day.
- Bought AMZN at $221.60.
- Bought BXS at $13.71.
- I am still long PPL at $27.65, PCYC at $40.66, WNR at $20.51, VCI at $19.41
Charts:


Welcome to Swing Trading the Stock Market Podcast!
I want you to become a better trader, and you know what? You absolutely can!
Commit these three rules to memory and to your trading:
#1: Manage the RISK ALWAYS!
#2: Keep the Losses Small
#3: Do #1 & #2 and the profits will take care of themselves.
That’s right, successful swing-trading is about managing the risk, and with Swing Trading the Stock Market podcast, I encourage you to email me (ryan@shareplanner.com) your questions, and there’s a good chance I’ll make a future podcast out of your stock market related question.
Watching the dollars rise and fall in your trading account can turn a well-planned swing trade into an emotional, deeply personal decision. In this episode, I explain why focusing on price action, percentage returns, and R-multiples can help you avoid cutting winners early, holding losers too long, and abandoning your trading plan.
Be sure to check out my Swing-Trading offering through SharePlanner that goes hand-in-hand with my podcast, offering all of the research, charts and technical analysis on the stock market and individual stocks, not to mention my personal watch-lists, reviews and regular updates on the most popular stocks, including the all-important big tech stocks. Check it out now at: https://www.shareplanner.com/premium-plans
📈 START SWING-TRADING WITH ME! 📈
Click here to subscribe: https://shareplanner.com/tradingblock
— — — — — — — — —
💻 STOCK MARKET TRAINING COURSES 💻
Click here for all of my training courses: https://www.shareplanner.com/trading-academy
– The A-Z of the Self-Made Trader –https://www.shareplanner.com/the-a-z-of-the-self-made-trader
– The Winning Watch-List — https://www.shareplanner.com/winning-watchlist
– Patterns to Profits — https://www.shareplanner.com/patterns-to-profits
– Get 1-on-1 Coaching — https://www.shareplanner.com/coaching
— — — — — — — — —
❤️ SUBSCRIBE TO MY YOUTUBE CHANNEL 📺
Click here to subscribe: https://www.youtube.com/shareplanner?sub_confirmation=1
🎧 LISTEN TO MY PODCAST 🎵
Click here to listen to my podcast: https://open.spotify.com/show/5Nn7MhTB9HJSyQ0C6bMKXI
— — — — — — — — —
💰 FREE RESOURCES 💰
— — — — — — — — —
🛠 TOOLS OF THE TRADE 🛠
Software I use (TC2000): https://bit.ly/2HBdnBm
— — — — — — — — —
📱 FOLLOW SHAREPLANNER ON SOCIAL MEDIA 📱
*Disclaimer: Ryan Mallory is not a financial adviser and this podcast is for entertainment purposes only. Consult your financial adviser before making any decisions.

You Might Like

South Korea: The Hidden Driver of US Tech Volatility

Stop Trying to Hit Home Runs: Start Trading Within Your Means

How to Trade Breakouts Without Getting Trapped