
Economic Reports Due out (Times are EST): Consumer Credit (3pm)
Premarket Update (Updated 8:00am eastern):
- US futures are slightly down ahead of the open and has recovered significantly off of the overnight lows.
- Asian markets are taking a heavy hit, down on average 2.7%.
- European markets are trading in a wide range – down as low as -1.9% and as high as +0.1%.
Technical Outlook (S&P):
- The S&P saw a significant sell-off yesterday, for the third straight day on Friday.
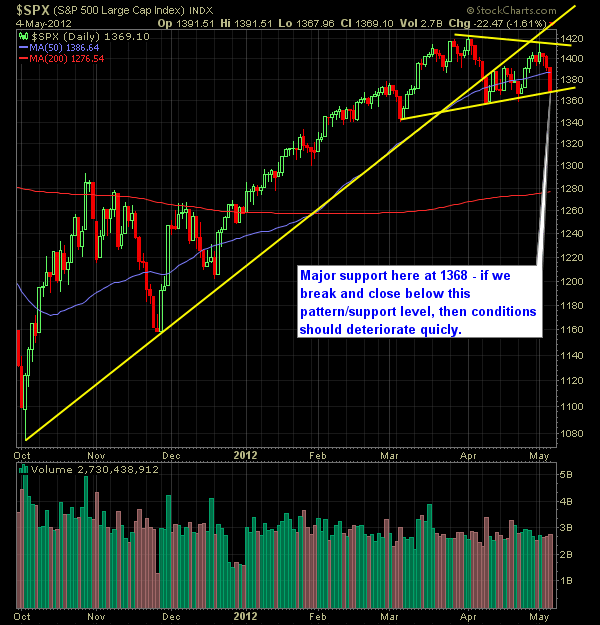
- Significant support in the short-term is being tested at 1368
- We have seen a substantial amount of weakness in the futures session that began on Sunday night (as much as 17 points down on the S&P at one point), but has managed to erase most of the weakness.
- S&P is back to short-term oversold territory today. We tend to get bounces in the market rather quickly in this area.
- Triangle pattern has formed on the S&P with a series of higher-lows a and lower-highs (see below chart).
- The S&P experienced an increased amount of selling Friday, and is back inside of the 1392/1357 price range, which muddles the market outlooks some. Possibility of the market breaking through the lower channel today.
- There is a short-term slight uptrend in place off of the 3/6 lows with support today at 1368.
- The S&P is now trading below the 10-day, 20-day and 50-day moving averages.
- Head and shoulders pattern we outlined the past few sessions on the 30-minute chart hit its target prices and worked out perfectly.
- The market’s whip-saw action of late has created a convergence of moving averages (10, 20 & 50 DMA’s).
- The previous trend-line off of the October lows has become resistance for price action on the underside.
- On the weekly chart, we confirmed the bearish wedge pattern that we had been following for weeks. Very bearish development for the market.
My Opinions & Trades:
- While I have abandoned any bullish expectations for this market, the recent move to the downside happened so suddenly and swiftly, that the possibilities of getting short this market in a heavy way is dangerous as it is very possible the shorts may get squeezed here soon.
- Covered AXS at $34.40 from 34.16 for a -0.7% loss – just never broke down for us.
- Covered KCG at $12.94 from $13.3 for a 3.4% gain.
- Sold RHT at $59.44 from $61.17 for a -2.8% loss.
- Sold JPM $42.24 from $44.08 for a -4.1% loss.
- Still shorted VAR at $64.69
- Remain long HBAN at $6.66
Chart:


Welcome to Swing Trading the Stock Market Podcast!
I want you to become a better trader, and you know what? You absolutely can!
Commit these three rules to memory and to your trading:
#1: Manage the RISK ALWAYS!
#2: Keep the Losses Small
#3: Do #1 & #2 and the profits will take care of themselves.
That’s right, successful swing-trading is about managing the risk, and with Swing Trading the Stock Market podcast, I encourage you to email me (ryan@shareplanner.com) your questions, and there’s a good chance I’ll make a future podcast out of your stock market related question.
In today's episode, at episode 500, I am diving into the lessons learned from trading over the last 100 episodes, because as traders we are evolving and always attempting to improve our skillset. So here is to episode 500, and to another 500 episodes of learning and developing as swing traders in the stock market!
Be sure to check out my Swing-Trading offering through SharePlanner that goes hand-in-hand with my podcast, offering all of the research, charts and technical analysis on the stock market and individual stocks, not to mention my personal watch-lists, reviews and regular updates on the most popular stocks, including the all-important big tech stocks. Check it out now at: https://www.shareplanner.com/premium-plans
📈 START SWING-TRADING WITH ME! 📈
Click here to subscribe: https://shareplanner.com/tradingblock
— — — — — — — — —
💻 STOCK MARKET TRAINING COURSES 💻
Click here for all of my training courses: https://www.shareplanner.com/trading-academy
– The A-Z of the Self-Made Trader –https://www.shareplanner.com/the-a-z-of-the-self-made-trader
– The Winning Watch-List — https://www.shareplanner.com/winning-watchlist
– Patterns to Profits — https://www.shareplanner.com/patterns-to-profits
– Get 1-on-1 Coaching — https://www.shareplanner.com/coaching
— — — — — — — — —
❤️ SUBSCRIBE TO MY YOUTUBE CHANNEL 📺
Click here to subscribe: https://www.youtube.com/shareplanner?sub_confirmation=1
🎧 LISTEN TO MY PODCAST 🎵
Click here to listen to my podcast: https://open.spotify.com/show/5Nn7MhTB9HJSyQ0C6bMKXI
— — — — — — — — —
💰 FREE RESOURCES 💰
— — — — — — — — —
🛠 TOOLS OF THE TRADE 🛠
Software I use (TC2000): https://bit.ly/2HBdnBm
— — — — — — — — —
📱 FOLLOW SHAREPLANNER ON SOCIAL MEDIA 📱
*Disclaimer: Ryan Mallory is not a financial adviser and this podcast is for entertainment purposes only. Consult your financial adviser before making any decisions.
You Might Like

The Retail Trading Revolution: How Small Investors Are Reshaping the Stock Market

Fading the Gap: How Large Overnight Moves in SPY and QQQ Play Out During the Trading Day

How to Trade a Bear Flag