
Economic Reports Due out (Times are EST): ICSC-Goldman Store Sales (7:45am), Redbook (8:55am), Treasury STRIPS (3pm)
Premarket Update (Updated 6:30am eastern):
- US Futures are down strong, nearly -1%
- Asian markets saw losses range from -0.6% down to -2.1%.
- European markets are trading -1.5% lower.
Technical Outlook (S&P):
- The S&P is poised for its first significant day of downside follow-through this year.
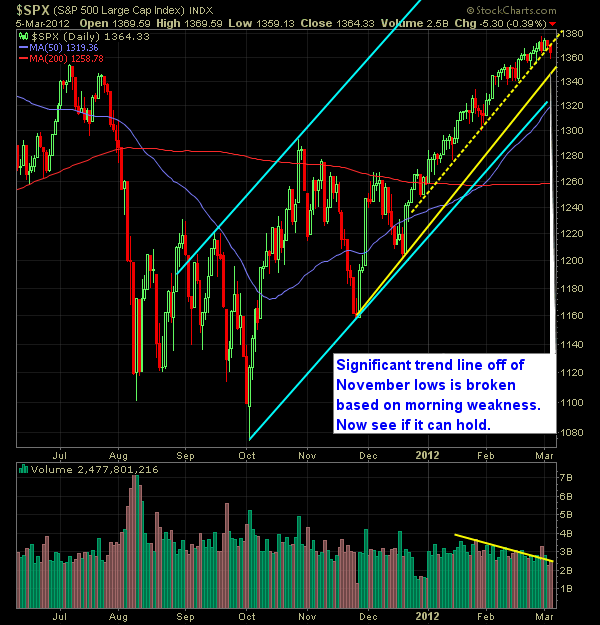
- If current weakness holds, the S&P will gap below its 20-day moving average as well as its longer-term trend-line that started back on 11/28.
- After you break the aforementioned support levels, there are no other significant support levels nearby. Watch the support level off of the October lows which currently sits at 1327 and converges with the down trend off of the 2007 highs.
- The big test for bears is whether they can stave off the inevitable buy-the-dip crowd that will at some point test the strength of this sell-off.
- S&P also managed to close below the 10-day moving average for only the second time this year. Last time this event was bought up immediately the next day.
- 30-minute chart on the S&P is very close to making a lower-low on the chart.
- S&P’s uptrend since November forms a bearish wedge.
- Price action on the 30-min chart is looking choppy of late.
- Key for the bulls is to get price action back above 1370. When looked through the prism of a 15-year chart, represents a very strong price level where markets have historically reversed at.
- We’ve yet to see a sell-off this year that exceeded 1% to the downside.
My Opinions:
- Though I believe this market is prime for a pullback, I am nonetheless very skeptical of whether it can actually hold off the dip-buyers and thus keep the bulls from pushing price back into the gap and possibly filling it.
- For more than 10 years, the first two weeks of March have been horrible for the bulls – seeing strong sell-offs (with the exception being 2010 and the second week of 2009). Second half of the month has fared much better. It is an incredible phenomenon.
- It will be difficult for the market to show much of any weakness until the rug gets pulled out from underneath Apple (AAPL) due to its heavy weight influence on the S&P and in particular the Nasdaq. We started to see somewhat of a break in AAPL yesterday.
- Bears tend to perform the best when they don’t have to hold a gap down, and instead work with a flat or slightly positive open. Today you have the gap-down, which will no doubt will see an attempt to buy the gap very soon after the opening bell.
- I’m using January-February of last year as my roadmap for trading this market – price action is nearly identical, as is the time frames too. With that being said, it is likely we see a pullback of worth here in the very near future.
Chart:


Welcome to Swing Trading the Stock Market Podcast!
I want you to become a better trader, and you know what? You absolutely can!
Commit these three rules to memory and to your trading:
#1: Manage the RISK ALWAYS!
#2: Keep the Losses Small
#3: Do #1 & #2 and the profits will take care of themselves.
That’s right, successful swing-trading is about managing the risk, and with Swing Trading the Stock Market podcast, I encourage you to email me (ryan@shareplanner.com) your questions, and there’s a good chance I’ll make a future podcast out of your stock market related question.
Watching the dollars rise and fall in your trading account can turn a well-planned swing trade into an emotional, deeply personal decision. In this episode, I explain why focusing on price action, percentage returns, and R-multiples can help you avoid cutting winners early, holding losers too long, and abandoning your trading plan.
Be sure to check out my Swing-Trading offering through SharePlanner that goes hand-in-hand with my podcast, offering all of the research, charts and technical analysis on the stock market and individual stocks, not to mention my personal watch-lists, reviews and regular updates on the most popular stocks, including the all-important big tech stocks. Check it out now at: https://www.shareplanner.com/premium-plans
📈 START SWING-TRADING WITH ME! 📈
Click here to subscribe: https://shareplanner.com/tradingblock
— — — — — — — — —
💻 STOCK MARKET TRAINING COURSES 💻
Click here for all of my training courses: https://www.shareplanner.com/trading-academy
– The A-Z of the Self-Made Trader –https://www.shareplanner.com/the-a-z-of-the-self-made-trader
– The Winning Watch-List — https://www.shareplanner.com/winning-watchlist
– Patterns to Profits — https://www.shareplanner.com/patterns-to-profits
– Get 1-on-1 Coaching — https://www.shareplanner.com/coaching
— — — — — — — — —
❤️ SUBSCRIBE TO MY YOUTUBE CHANNEL 📺
Click here to subscribe: https://www.youtube.com/shareplanner?sub_confirmation=1
🎧 LISTEN TO MY PODCAST 🎵
Click here to listen to my podcast: https://open.spotify.com/show/5Nn7MhTB9HJSyQ0C6bMKXI
— — — — — — — — —
💰 FREE RESOURCES 💰
— — — — — — — — —
🛠 TOOLS OF THE TRADE 🛠
Software I use (TC2000): https://bit.ly/2HBdnBm
— — — — — — — — —
📱 FOLLOW SHAREPLANNER ON SOCIAL MEDIA 📱
*Disclaimer: Ryan Mallory is not a financial adviser and this podcast is for entertainment purposes only. Consult your financial adviser before making any decisions.

You Might Like

South Korea: The Hidden Driver of US Tech Volatility

Stop Trying to Hit Home Runs: Start Trading Within Your Means

How to Trade Breakouts Without Getting Trapped