
Pre-market update (updated 9:00am eastern):
- European markets are trading mixed and 0.1% higher.
- Asian markets traded 0.8% higher but in mixed fashion..
- US futures are trading slightly lower ahead of the opening bell..
Economic reports due out (all times are eastern): None
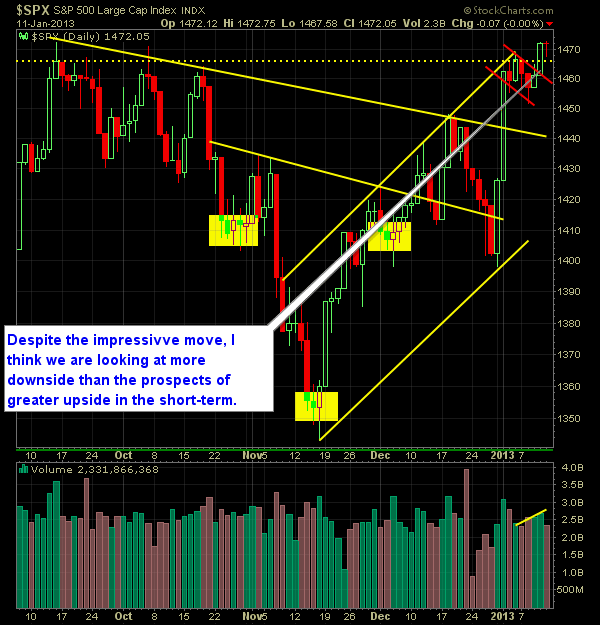
Technical Outlook (SPX):
- After trying to dip lower on Friday, SPX managed to finish the day near break-even, but with the candle pattern of a shooting star.
- Often times this can represent a bearish short-term peak in the market.
- Markets can rally far longer than you’d expect them to. But considering extent of the current bounce off of the previous lower-low and comparing other similar trends, we should be nearing the top of the current price range before pulling back to form a new higher-low.
- A short-term push below 1451 would give good reason to tighten stops or take gains on existing positions and let the the pullback work its magic.
- Bull-flag that we had mentioned before on the SPX was confirmed on Thursday.
- Apple has some negative news out regarding waning demand, impacting its stock and the Nasdaq as well.
- SPX is trading at 5 year highs.
- Volume remains steady over the past few weeks of trading.
- 30-minute chart shows a nice breakout of previous consolidation, but looks extremely vulnerable if we break that 1451 level on a pullback.
- Of late, there have been quite a few market rallies/sell-offs in the last hour of trading, much like what we saw on Friday.
- The VIX closed at new recent lows again, and almost below 13.
- There really isn’t any support found on any of the major moving averages.
- Notice the channel that we are currently trading in, off of the November lows (see chart below).
- There’s really no significant level of resistance for the market above 1466 until you get to 1501.
- It will take a significant move, but below 1398, the trend will be very bearish.
- Be aware of upcoming news events and discussions that will permeate the markets: Debt Ceiling Debate, Fiscal Cliff Part II, Employment Recovery.
- There is still a huge gap on the SPY chart that ultimately needs to be filled.
My Opinions & Trades:
- Went long on WCC at $68.24.
- Remain Short TEVA at $38.10 and Long VMC at $53.35, EW at $93.15.
- Here is my real-time swing-trading portfolio and past-performance
Chart for SPX:


Welcome to Swing Trading the Stock Market Podcast!
I want you to become a better trader, and you know what? You absolutely can!
Commit these three rules to memory and to your trading:
#1: Manage the RISK ALWAYS!
#2: Keep the Losses Small
#3: Do #1 & #2 and the profits will take care of themselves.
That’s right, successful swing-trading is about managing the risk, and with Swing Trading the Stock Market podcast, I encourage you to email me (ryan@shareplanner.com) your questions, and there’s a good chance I’ll make a future podcast out of your stock market related question.
Watching the dollars rise and fall in your trading account can turn a well-planned swing trade into an emotional, deeply personal decision. In this episode, I explain why focusing on price action, percentage returns, and R-multiples can help you avoid cutting winners early, holding losers too long, and abandoning your trading plan.
Be sure to check out my Swing-Trading offering through SharePlanner that goes hand-in-hand with my podcast, offering all of the research, charts and technical analysis on the stock market and individual stocks, not to mention my personal watch-lists, reviews and regular updates on the most popular stocks, including the all-important big tech stocks. Check it out now at: https://www.shareplanner.com/premium-plans
📈 START SWING-TRADING WITH ME! 📈
Click here to subscribe: https://shareplanner.com/tradingblock
— — — — — — — — —
💻 STOCK MARKET TRAINING COURSES 💻
Click here for all of my training courses: https://www.shareplanner.com/trading-academy
– The A-Z of the Self-Made Trader –https://www.shareplanner.com/the-a-z-of-the-self-made-trader
– The Winning Watch-List — https://www.shareplanner.com/winning-watchlist
– Patterns to Profits — https://www.shareplanner.com/patterns-to-profits
– Get 1-on-1 Coaching — https://www.shareplanner.com/coaching
— — — — — — — — —
❤️ SUBSCRIBE TO MY YOUTUBE CHANNEL 📺
Click here to subscribe: https://www.youtube.com/shareplanner?sub_confirmation=1
🎧 LISTEN TO MY PODCAST 🎵
Click here to listen to my podcast: https://open.spotify.com/show/5Nn7MhTB9HJSyQ0C6bMKXI
— — — — — — — — —
💰 FREE RESOURCES 💰
— — — — — — — — —
🛠 TOOLS OF THE TRADE 🛠
Software I use (TC2000): https://bit.ly/2HBdnBm
— — — — — — — — —
📱 FOLLOW SHAREPLANNER ON SOCIAL MEDIA 📱
*Disclaimer: Ryan Mallory is not a financial adviser and this podcast is for entertainment purposes only. Consult your financial adviser before making any decisions.

You Might Like

South Korea: The Hidden Driver of US Tech Volatility

Stop Trying to Hit Home Runs: Start Trading Within Your Means

How to Trade Breakouts Without Getting Trapped