

Technical Outlook:
- Huge move on Friday following the negative interest rate announcement by the Bank of Japan, creating a 46 point move on SPX and a massive short squeeze as a result.
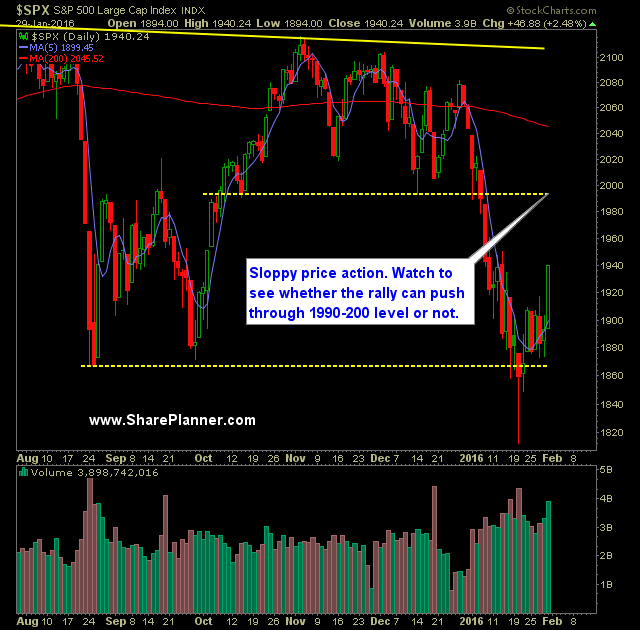
- I still consider this bounce at this point to be a dead cat bounce with a ceiling of around 1990-2000. If this level breaks, you have a legitimate opportunity for the market to make a far bigger bullish move higher into the upper 2000’s.
- 20-day moving average was recaptured for the first time this year on Friday.
- SPY volume was much stronger than what we have seen of late and the highest since 1/20/16.
- SPX 30 minute chart shows a breakout of the 30 minute chart’s inverse head and shoulders pattern.
- VIX only dropped 9.9% on Friday down to 20.20. Considering how elevated it was, I would have expected a bigger move, since the SPX moved 46 points.
- T2108 (% of stocks trading above the 40-day moving average) popped 62% to close at 29.43. A very justified move that indicates that the market is no longer oversold as it once was.
- USO actually wasn’t part of the rally on Friday, instead falling 1/2 percentage point. Additional weakness this weak will likely signal the end of the dead cat bounce for equities.
- Confirming the head and shoulders pattern on the weekly chart of SPX/SPY will be critical for the bears if they are going to keep the downtrend going.
My Trades:
- Closed out DCI at $28.30 for a 1.4% gain.
- Covered IWM at $102.73 for a 3.2% loss.
- Did not add any additional swing-trades to the portfolio.
- Currently 100% Cash
- Staying light in this market is absolutely key. Strong bias at this stage is dangerous.
- Join me each day for all my real-time trades and alerts in the SharePlanner Splash Zone
Chart for SPX:


Welcome to Swing Trading the Stock Market Podcast!
I want you to become a better trader, and you know what? You absolutely can!
Commit these three rules to memory and to your trading:
#1: Manage the RISK ALWAYS!
#2: Keep the Losses Small
#3: Do #1 & #2 and the profits will take care of themselves.
That’s right, successful swing-trading is about managing the risk, and with Swing Trading the Stock Market podcast, I encourage you to email me (ryan@shareplanner.com) your questions, and there’s a good chance I’ll make a future podcast out of your stock market related question.
Watching the dollars rise and fall in your trading account can turn a well-planned swing trade into an emotional, deeply personal decision. In this episode, I explain why focusing on price action, percentage returns, and R-multiples can help you avoid cutting winners early, holding losers too long, and abandoning your trading plan.
Be sure to check out my Swing-Trading offering through SharePlanner that goes hand-in-hand with my podcast, offering all of the research, charts and technical analysis on the stock market and individual stocks, not to mention my personal watch-lists, reviews and regular updates on the most popular stocks, including the all-important big tech stocks. Check it out now at: https://www.shareplanner.com/premium-plans
📈 START SWING-TRADING WITH ME! 📈
Click here to subscribe: https://shareplanner.com/tradingblock
— — — — — — — — —
💻 STOCK MARKET TRAINING COURSES 💻
Click here for all of my training courses: https://www.shareplanner.com/trading-academy
– The A-Z of the Self-Made Trader –https://www.shareplanner.com/the-a-z-of-the-self-made-trader
– The Winning Watch-List — https://www.shareplanner.com/winning-watchlist
– Patterns to Profits — https://www.shareplanner.com/patterns-to-profits
– Get 1-on-1 Coaching — https://www.shareplanner.com/coaching
— — — — — — — — —
❤️ SUBSCRIBE TO MY YOUTUBE CHANNEL 📺
Click here to subscribe: https://www.youtube.com/shareplanner?sub_confirmation=1
🎧 LISTEN TO MY PODCAST 🎵
Click here to listen to my podcast: https://open.spotify.com/show/5Nn7MhTB9HJSyQ0C6bMKXI
— — — — — — — — —
💰 FREE RESOURCES 💰
— — — — — — — — —
🛠 TOOLS OF THE TRADE 🛠
Software I use (TC2000): https://bit.ly/2HBdnBm
— — — — — — — — —
📱 FOLLOW SHAREPLANNER ON SOCIAL MEDIA 📱
*Disclaimer: Ryan Mallory is not a financial adviser and this podcast is for entertainment purposes only. Consult your financial adviser before making any decisions.

You Might Like

South Korea: The Hidden Driver of US Tech Volatility

Stop Trying to Hit Home Runs: Start Trading Within Your Means

How to Trade Breakouts Without Getting Trapped