
Pre-market update (updated 8:30am eastern):
- European markets are trading -0.4% lower.
- Asian markets traded mixed and -1.0% lower.
- US futures are trading slightly lower ahead of the opening bell..
Economic reports due out (all times are eastern): MBA Purchase Applications (7am), Consumer Price Index (8:30am), Treasury International Capital (9am), Industrial Production (9:15am), Housing Market Index (10am), EIA Petroleum Status Report (10:30am), Beige Book (2pm)
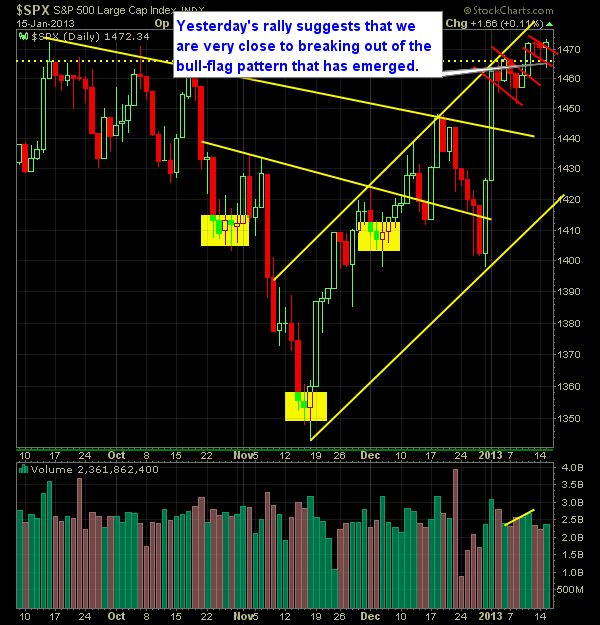
Technical Outlook (SPX):
- Another similar day to the prior two days where price opened lower, sold-off, popped, consolidated and rallied into the close.
- Chalk up yesterday to another positive day of consolidation with long candle shadows underneath.
- This suggests that the dip-buying continues to get more and more aggressive.
- SPX has managed to trade at the highs while the Nasdaq has pulled back. Now that the Nasdaq is trading in positive territory today, will that lead the SPX to finally push through to new highs?
- For nine straight days – the 10-day moving average has offered positive support for the bulls as it trades just above it.
- Volume remained relatively steady over the pat month. No major spikes or decreases.
- It almost appears as if we are trying to create another bull-flag which would have started just one day after breaking out of another bull-flag. If that is the case, there could be concern that the market is lacking sustained buying power to move the markets higher, and instead is having to rely on quick bursts.
- Markets can rally far longer than you’d expect them to. But considering extent of the current bounce off of the previous lower-low and comparing other similar trends, we should be nearing the top of the current price range before pulling back to form a new higher-low.
- A short-term push below 1451 would give good reason to tighten stops or take gains on existing positions and let the the pullback work its magic.
- 30-minute chart looks like it is on the verge of a breakout of consolidation.
- Of late, there have been quite a few market rallies/sell-offs in the last hour of trading, much like what we saw yesterday and Friday.
- The VIX remains in the 13’s .
- There really isn’t any support found on any of the major moving averages.
- Notice the channel that we are currently trading in, off of the November lows (see chart below).
- There’s really no significant level of resistance for the market above 1466 until you get to 1501.
- It will take a significant move, but below 1398, the trend will be very bearish.
- Be aware of upcoming news events and discussions that will permeate the markets: Debt Ceiling Debate, Fiscal Cliff Part II, Employment Recovery.
- There is still a huge gap on the SPY chart that ultimately needs to be filled.
My Opinions & Trades:
- Went long on LO at $39.16 (3-for-1 stock split)
- Stopped out of EW at $89.99 for a -3.4% loss. .
- Remain Short TEVA at $38.10 and Long VMC at $53.35, WCC at $68.24, BG at $75.11.
- Here is my real-time swing-trading portfolio and past-performance
Chart for SPX:


Welcome to Swing Trading the Stock Market Podcast!
I want you to become a better trader, and you know what? You absolutely can!
Commit these three rules to memory and to your trading:
#1: Manage the RISK ALWAYS!
#2: Keep the Losses Small
#3: Do #1 & #2 and the profits will take care of themselves.
That’s right, successful swing-trading is about managing the risk, and with Swing Trading the Stock Market podcast, I encourage you to email me (ryan@shareplanner.com) your questions, and there’s a good chance I’ll make a future podcast out of your stock market related question.
Watching the dollars rise and fall in your trading account can turn a well-planned swing trade into an emotional, deeply personal decision. In this episode, I explain why focusing on price action, percentage returns, and R-multiples can help you avoid cutting winners early, holding losers too long, and abandoning your trading plan.
Be sure to check out my Swing-Trading offering through SharePlanner that goes hand-in-hand with my podcast, offering all of the research, charts and technical analysis on the stock market and individual stocks, not to mention my personal watch-lists, reviews and regular updates on the most popular stocks, including the all-important big tech stocks. Check it out now at: https://www.shareplanner.com/premium-plans
📈 START SWING-TRADING WITH ME! 📈
Click here to subscribe: https://shareplanner.com/tradingblock
— — — — — — — — —
💻 STOCK MARKET TRAINING COURSES 💻
Click here for all of my training courses: https://www.shareplanner.com/trading-academy
– The A-Z of the Self-Made Trader –https://www.shareplanner.com/the-a-z-of-the-self-made-trader
– The Winning Watch-List — https://www.shareplanner.com/winning-watchlist
– Patterns to Profits — https://www.shareplanner.com/patterns-to-profits
– Get 1-on-1 Coaching — https://www.shareplanner.com/coaching
— — — — — — — — —
❤️ SUBSCRIBE TO MY YOUTUBE CHANNEL 📺
Click here to subscribe: https://www.youtube.com/shareplanner?sub_confirmation=1
🎧 LISTEN TO MY PODCAST 🎵
Click here to listen to my podcast: https://open.spotify.com/show/5Nn7MhTB9HJSyQ0C6bMKXI
— — — — — — — — —
💰 FREE RESOURCES 💰
— — — — — — — — —
🛠 TOOLS OF THE TRADE 🛠
Software I use (TC2000): https://bit.ly/2HBdnBm
— — — — — — — — —
📱 FOLLOW SHAREPLANNER ON SOCIAL MEDIA 📱
*Disclaimer: Ryan Mallory is not a financial adviser and this podcast is for entertainment purposes only. Consult your financial adviser before making any decisions.

You Might Like

South Korea: The Hidden Driver of US Tech Volatility

Stop Trying to Hit Home Runs: Start Trading Within Your Means

How to Trade Breakouts Without Getting Trapped