
Technical Outlook:
- Strong rally yesterday changed the look and feel of the sell-off that we have seen over the last three weeks.

- One day rally essentially wiped out the previous two weeks of selling.
- Just goes to show you how shallow this current sell-off is. Typical 3-week sell-offs see on average -6.3% loss. This current sell-off only fell 2.2%.
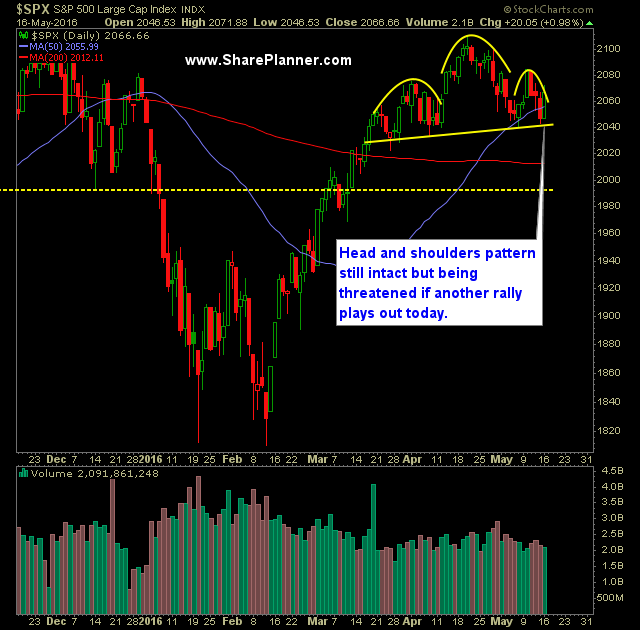
- Despite yesterday’s rally, SPX was unable to reclaim the middle band or the 20-day moving average. However, the 5, 10, and 50-day moving averages were reclaimed.
- The moving averages are all converging on current price action and primarily that is a sign of a market that hasn’t moved any where in a couple of months.
- The last two times we saw this happen, a massive sell-off ensued (last August and December/January).
- SPY volume dropped off yesterday and was well below recent averages.
- 30 minute chart of SPX is difficult to get a good read. SPX rallied up to the previous lower-high, but could not break through. Instead it sold off hard.
- Crude continues to run in an incredible fashion. Trading another 3% higher yesterday.
- USO quickly approaching its 200-day moving average. Previous rallies in oil fizzled anytime it got even close.
- VIX showed signs early on that it may want to make a challenge at 16.40, but it quickly faded with the rally in stocks.
- A very significant inverse head and shoulders pattern on VIX has formed.
- Still there is a massive head and shoulders pattern that has been forming over the past two months on SPX. A move today and close below 2039 would confirm the head and shoulders pattern and break below its neckline.
- Should the same happen, it would result in a move likely below 2000 and into the 1940’s – 1960’s range.
- If SPX manages to dip below 2040, the ability for the market to move in much bigger chunks in either direction becomes very possible.
- From 2040 to 2138 – you have a price range that is insanely choppy and continues to be such. As a result, profits have to be taken quickly and often.
- The 50-week and 100-week moving average have crossed two weeks ago to the downside. Last time this happened was 2001 before the tech correction and again in June 2008 before the mortgage crisis saw its major correction.
- I believe at this point, profits have to be taken aggressively, and avoid the tendency to let the profits run – the market is in a very choppy range that has mired stock price for the past two years. Unless it breaks out of it and onto new all-time highs, then taking profits aggressively is absolutely important.
- Historically the May through October time frame is much weaker than the rest of the year.
My Trades:
- Covered IWM at $111.09 for a 0.2% profit yesterday.
- Added one additional short position yesterday.
- Currently 20% Short / 80% Cash
- Will loook to see whether the market rally was a dead cat bounce yesterday or whether it marked a reversal to the upside and trade accordingly.
- Join me each day for all my real-time trades and alerts in the SharePlanner Splash Zone
Chart for SPX:


Welcome to Swing Trading the Stock Market Podcast!
I want you to become a better trader, and you know what? You absolutely can!
Commit these three rules to memory and to your trading:
#1: Manage the RISK ALWAYS!
#2: Keep the Losses Small
#3: Do #1 & #2 and the profits will take care of themselves.
That’s right, successful swing-trading is about managing the risk, and with Swing Trading the Stock Market podcast, I encourage you to email me (ryan@shareplanner.com) your questions, and there’s a good chance I’ll make a future podcast out of your stock market related question.
Watching the dollars rise and fall in your trading account can turn a well-planned swing trade into an emotional, deeply personal decision. In this episode, I explain why focusing on price action, percentage returns, and R-multiples can help you avoid cutting winners early, holding losers too long, and abandoning your trading plan.
Be sure to check out my Swing-Trading offering through SharePlanner that goes hand-in-hand with my podcast, offering all of the research, charts and technical analysis on the stock market and individual stocks, not to mention my personal watch-lists, reviews and regular updates on the most popular stocks, including the all-important big tech stocks. Check it out now at: https://www.shareplanner.com/premium-plans
📈 START SWING-TRADING WITH ME! 📈
Click here to subscribe: https://shareplanner.com/tradingblock
— — — — — — — — —
💻 STOCK MARKET TRAINING COURSES 💻
Click here for all of my training courses: https://www.shareplanner.com/trading-academy
– The A-Z of the Self-Made Trader –https://www.shareplanner.com/the-a-z-of-the-self-made-trader
– The Winning Watch-List — https://www.shareplanner.com/winning-watchlist
– Patterns to Profits — https://www.shareplanner.com/patterns-to-profits
– Get 1-on-1 Coaching — https://www.shareplanner.com/coaching
— — — — — — — — —
❤️ SUBSCRIBE TO MY YOUTUBE CHANNEL 📺
Click here to subscribe: https://www.youtube.com/shareplanner?sub_confirmation=1
🎧 LISTEN TO MY PODCAST 🎵
Click here to listen to my podcast: https://open.spotify.com/show/5Nn7MhTB9HJSyQ0C6bMKXI
— — — — — — — — —
💰 FREE RESOURCES 💰
— — — — — — — — —
🛠 TOOLS OF THE TRADE 🛠
Software I use (TC2000): https://bit.ly/2HBdnBm
— — — — — — — — —
📱 FOLLOW SHAREPLANNER ON SOCIAL MEDIA 📱
*Disclaimer: Ryan Mallory is not a financial adviser and this podcast is for entertainment purposes only. Consult your financial adviser before making any decisions.

You Might Like

South Korea: The Hidden Driver of US Tech Volatility

Stop Trying to Hit Home Runs: Start Trading Within Your Means

How to Trade Breakouts Without Getting Trapped