
Technical Outlook:
- S&P 500 (SPX) managed to put together another bounce back rally that was quite simply meaningless in terms of accomplishing anything technically.

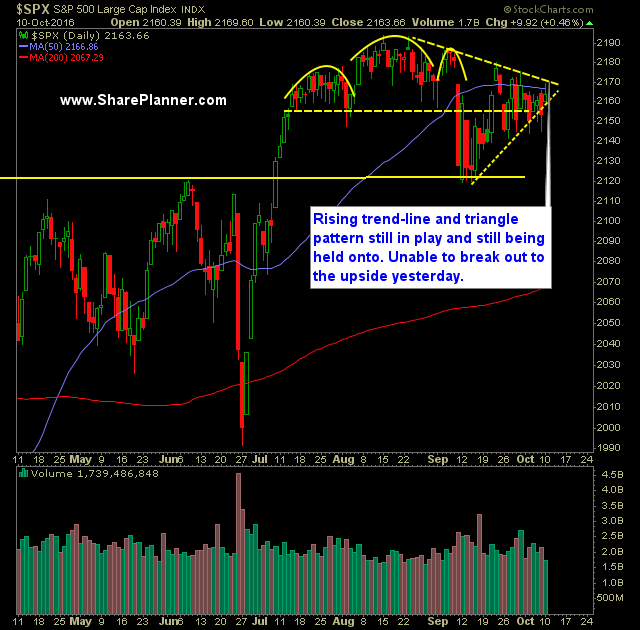
- The declining trend-line from the August highs was tested yesterday and saw a rejection in price with SPX retracing 40% of its gains on the day.
- Despite breaking it early on, once again the 50-day moving average was unable to see price close above it.
- Volume on SPDRs S&P 500 (SPY) rally yesterday failed to provide a good reading, coming in at the lowest since August 15th and at levels seen during a half day of trading on Christmas Eve.
- Rising trend-line off of the February lows are in view again with current support at 2147. Break it, then the next two support levels are 2144 and 2120.
- Taking the declining and rising trend-lines already mentioned already, you have a triangle that is forming near the highs of SPX. Typically these triangles, at this location, typically results in topping patterns that end badly for the bulls.
- Crude (/CL) made a big move yesterday on rumors Russia is willing to freeze or possibly cut production, causing oil to spike 3%. Now it is setting up for a move back to the June highs.
- Nasdaq (COMPQ) is the strongest index by far right now and it had a great opportunityh to establish new all-time highs, but fell short by 2 points.
- Despite the rally yesterday, the CBOE Market Volatility Index (VIX) barely saw a drop yesterday.
- Price action on SPX 30 minute chart is absolutely unintelligible over the last 2 weeks. Simply chop-city. It does fall in nicely with the triangle pattern over the past month.
My Trades:
- Did not add any new positions yesterday.
- Closed MSFT yesterday at $58.21 for a 1.9% loss.
- Will look to add 1-2 new swing-trades to the portfolio today.
- Currently 10% Long / 30% Short / 60% Cash
- Join me each day for all my real-time trades and alerts in the SharePlanner Splash Zone
Chart for SPX:


Welcome to Swing Trading the Stock Market Podcast!
I want you to become a better trader, and you know what? You absolutely can!
Commit these three rules to memory and to your trading:
#1: Manage the RISK ALWAYS!
#2: Keep the Losses Small
#3: Do #1 & #2 and the profits will take care of themselves.
That’s right, successful swing-trading is about managing the risk, and with Swing Trading the Stock Market podcast, I encourage you to email me (ryan@shareplanner.com) your questions, and there’s a good chance I’ll make a future podcast out of your stock market related question.
In this podcast episode, Ryan discusses how really bad, losing trades in the stock market creates an impossible scenario for the trader in terms of what the right decision should be.
Be sure to check out my Swing-Trading offering through SharePlanner that goes hand-in-hand with my podcast, offering all of the research, charts and technical analysis on the stock market and individual stocks, not to mention my personal watch-lists, reviews and regular updates on the most popular stocks, including the all-important big tech stocks. Check it out now at: https://www.shareplanner.com/premium-plans
📈 START SWING-TRADING WITH ME! 📈
Click here to subscribe: https://shareplanner.com/tradingblock
— — — — — — — — —
💻 STOCK MARKET TRAINING COURSES 💻
Click here for all of my training courses: https://www.shareplanner.com/trading-academy
– The A-Z of the Self-Made Trader –https://www.shareplanner.com/the-a-z-of-the-self-made-trader
– The Winning Watch-List — https://www.shareplanner.com/winning-watchlist
– Patterns to Profits — https://www.shareplanner.com/patterns-to-profits
– Get 1-on-1 Coaching — https://www.shareplanner.com/coaching
— — — — — — — — —
❤️ SUBSCRIBE TO MY YOUTUBE CHANNEL 📺
Click here to subscribe: https://www.youtube.com/shareplanner?sub_confirmation=1
🎧 LISTEN TO MY PODCAST 🎵
Click here to listen to my podcast: https://open.spotify.com/show/5Nn7MhTB9HJSyQ0C6bMKXI
— — — — — — — — —
💰 FREE RESOURCES 💰
— — — — — — — — —
🛠 TOOLS OF THE TRADE 🛠
Software I use (TC2000): https://bit.ly/2HBdnBm
— — — — — — — — —
📱 FOLLOW SHAREPLANNER ON SOCIAL MEDIA 📱
FACEBOOK: https://facebook.com/shareplanner
*Disclaimer: Ryan Mallory is not a financial adviser and this podcast is for entertainment purposes only. Consult your financial adviser before making any decisions.
You Might Like

South Korea: The Hidden Driver of US Tech Volatility

Stop Trying to Hit Home Runs: Start Trading Within Your Means

How to Trade Breakouts Without Getting Trapped