
Technical Outlook:
- A significant day technically, for the S&P 500 (SPX) yesterday.

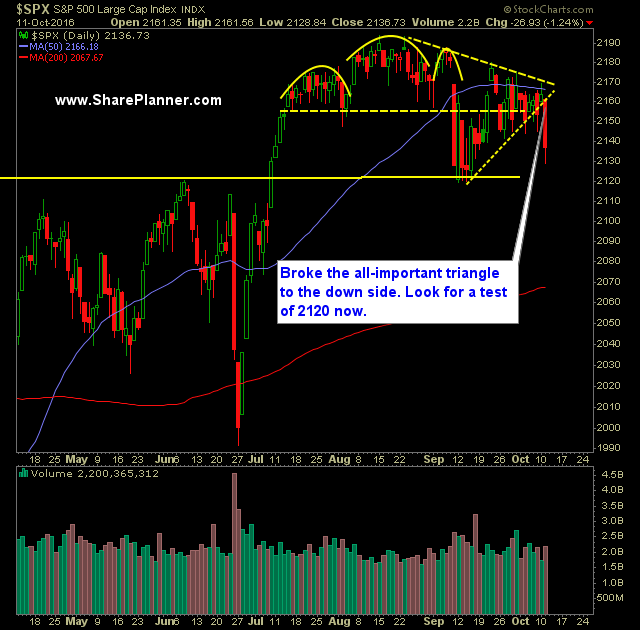
- The rising trend-line off of the February lows was broken.
- The triangle going back to early September that the market had been trading in, was broken to the downside as well.
- Still there was an end of day bounce that took price off of its lows of the day by a considerable amount, even though price action was still down -1.2%.
- Notable uptick in volume for SPDRs S&P 500 (SPY) yesterday. Volume was well above average and nearly three times the amount we saw the day prior.
- There are some notable gaps left unfilled on this chart – most notably the ones from the February low bounce which would require a significant correction, and the second one being from the Brexit rally back on 6/29.
- CBOE Market Volatility Index (VIX) had a big day for itself yesterday, rising 14.8%, but well off of its highs for the day, which has become obligatory for the VIX throughout 2016.
- Dip buyers are not afraid of this market, at least not yet. Dips are still being bought as was seen at the close yesterday, with the continued expectation that the market will always rally in their favor. It is a dangerous mindset that will eventually burn them bad.
- SPX 30 minute chart looking dramatically weakened and out of the 2-week chop area. It shows 2120 as being the next logical area for the market to test.
My Trades:
- Added two new short positions yesterday.
- Did not close out any positions yesterday.
- Will look to add 1-2 new swing-trades to the portfolio today.
- Currently 10% Long / 50% Short / 40% Cash
- Join me each day for all my real-time trades and alerts in the SharePlanner Splash Zone
Chart for SPX:


Welcome to Swing Trading the Stock Market Podcast!
I want you to become a better trader, and you know what? You absolutely can!
Commit these three rules to memory and to your trading:
#1: Manage the RISK ALWAYS!
#2: Keep the Losses Small
#3: Do #1 & #2 and the profits will take care of themselves.
That’s right, successful swing-trading is about managing the risk, and with Swing Trading the Stock Market podcast, I encourage you to email me (ryan@shareplanner.com) your questions, and there’s a good chance I’ll make a future podcast out of your stock market related question.
Watching the dollars rise and fall in your trading account can turn a well-planned swing trade into an emotional, deeply personal decision. In this episode, I explain why focusing on price action, percentage returns, and R-multiples can help you avoid cutting winners early, holding losers too long, and abandoning your trading plan.
Be sure to check out my Swing-Trading offering through SharePlanner that goes hand-in-hand with my podcast, offering all of the research, charts and technical analysis on the stock market and individual stocks, not to mention my personal watch-lists, reviews and regular updates on the most popular stocks, including the all-important big tech stocks. Check it out now at: https://www.shareplanner.com/premium-plans
📈 START SWING-TRADING WITH ME! 📈
Click here to subscribe: https://shareplanner.com/tradingblock
— — — — — — — — —
💻 STOCK MARKET TRAINING COURSES 💻
Click here for all of my training courses: https://www.shareplanner.com/trading-academy
– The A-Z of the Self-Made Trader –https://www.shareplanner.com/the-a-z-of-the-self-made-trader
– The Winning Watch-List — https://www.shareplanner.com/winning-watchlist
– Patterns to Profits — https://www.shareplanner.com/patterns-to-profits
– Get 1-on-1 Coaching — https://www.shareplanner.com/coaching
— — — — — — — — —
❤️ SUBSCRIBE TO MY YOUTUBE CHANNEL 📺
Click here to subscribe: https://www.youtube.com/shareplanner?sub_confirmation=1
🎧 LISTEN TO MY PODCAST 🎵
Click here to listen to my podcast: https://open.spotify.com/show/5Nn7MhTB9HJSyQ0C6bMKXI
— — — — — — — — —
💰 FREE RESOURCES 💰
— — — — — — — — —
🛠 TOOLS OF THE TRADE 🛠
Software I use (TC2000): https://bit.ly/2HBdnBm
— — — — — — — — —
📱 FOLLOW SHAREPLANNER ON SOCIAL MEDIA 📱
*Disclaimer: Ryan Mallory is not a financial adviser and this podcast is for entertainment purposes only. Consult your financial adviser before making any decisions.

You Might Like

South Korea: The Hidden Driver of US Tech Volatility

Stop Trying to Hit Home Runs: Start Trading Within Your Means

How to Trade Breakouts Without Getting Trapped