

My Swing Trading Approach
Yesterday afternoon I added two new positions to my portfolio – both of which are gapping considerably higher – AMZN and GOOGL. I’ll be looking to add at least one additional trade to the portfolio to play the rally today, if it holds.
Indicators
- Volatility Index (VIX) – VIX Up another 2 points or 8.8% yesterday to 25. Almost hit 30 intraday. Its highest close since 2/12/18. I would look for it to fade from these levels in the coming days.
- T2108 (% of stocks trading above their 40-day moving average): Selling off another 33% yesterday taking the indicator to an absurd 11%. That is a close lower than what we saw in February, and creates a high probability opportunity for the bulls to rally stocks from.
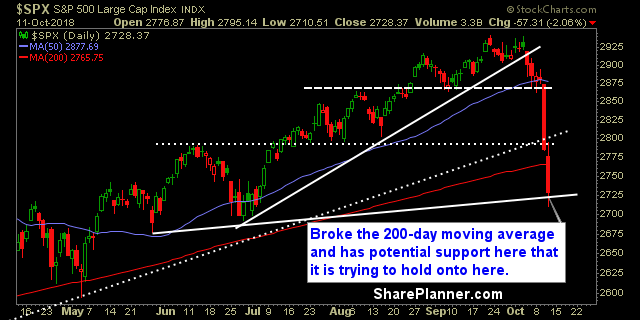
- Moving averages (SPX): $SPX broke its 200-day moving average. Watch to see if it bounces back above it today, similar to the break and rally back in April. Currently trading below all of its major moving averages.
- RELATED: Patterns to Profits: Training Course
Sectors to Watch Today
Technology is as oversold as you will ever see it. Down eight of the last nine trading sessions and almost 12%. Any market bounce will likely find Tech leading the way. Discretionary testing support levels from back in February/April. Rising channel in Telecom broke this week. Financials broke below its June low. This is the worst of all the sectors. Stay away. Energy may be ready to bounce here as well. 
My Market Sentiment
Yesterday’s sell-off had all the markings of exhaustion. At one point, the bulls bounced 52 points off the lows in less than an hour’s worth of trading on SPX, even though it gave up much of it before the close. That is a good sign that the bulls are looking to buy the weakness finally and push the market higher in the coming days.
S&P 500 Technical Analysis
Current Stock Trading Portfolio Balance
- 2 Long Positions.


Welcome to Swing Trading the Stock Market Podcast!
I want you to become a better trader, and you know what? You absolutely can!
Commit these three rules to memory and to your trading:
#1: Manage the RISK ALWAYS!
#2: Keep the Losses Small
#3: Do #1 & #2 and the profits will take care of themselves.
That’s right, successful swing-trading is about managing the risk, and with Swing Trading the Stock Market podcast, I encourage you to email me (ryan@shareplanner.com) your questions, and there’s a good chance I’ll make a future podcast out of your stock market related question.
In this podcast episode, Ryan discusses how really bad, losing trades in the stock market creates an impossible scenario for the trader in terms of what the right decision should be.
Be sure to check out my Swing-Trading offering through SharePlanner that goes hand-in-hand with my podcast, offering all of the research, charts and technical analysis on the stock market and individual stocks, not to mention my personal watch-lists, reviews and regular updates on the most popular stocks, including the all-important big tech stocks. Check it out now at: https://www.shareplanner.com/premium-plans
📈 START SWING-TRADING WITH ME! 📈
Click here to subscribe: https://shareplanner.com/tradingblock
— — — — — — — — —
💻 STOCK MARKET TRAINING COURSES 💻
Click here for all of my training courses: https://www.shareplanner.com/trading-academy
– The A-Z of the Self-Made Trader –https://www.shareplanner.com/the-a-z-of-the-self-made-trader
– The Winning Watch-List — https://www.shareplanner.com/winning-watchlist
– Patterns to Profits — https://www.shareplanner.com/patterns-to-profits
– Get 1-on-1 Coaching — https://www.shareplanner.com/coaching
— — — — — — — — —
❤️ SUBSCRIBE TO MY YOUTUBE CHANNEL 📺
Click here to subscribe: https://www.youtube.com/shareplanner?sub_confirmation=1
🎧 LISTEN TO MY PODCAST 🎵
Click here to listen to my podcast: https://open.spotify.com/show/5Nn7MhTB9HJSyQ0C6bMKXI
— — — — — — — — —
💰 FREE RESOURCES 💰
— — — — — — — — —
🛠 TOOLS OF THE TRADE 🛠
Software I use (TC2000): https://bit.ly/2HBdnBm
— — — — — — — — —
📱 FOLLOW SHAREPLANNER ON SOCIAL MEDIA 📱
FACEBOOK: https://facebook.com/shareplanner
*Disclaimer: Ryan Mallory is not a financial adviser and this podcast is for entertainment purposes only. Consult your financial adviser before making any decisions.
You Might Like

South Korea: The Hidden Driver of US Tech Volatility

Stop Trying to Hit Home Runs: Start Trading Within Your Means

How to Trade Breakouts Without Getting Trapped