

My Swing Trading Approach
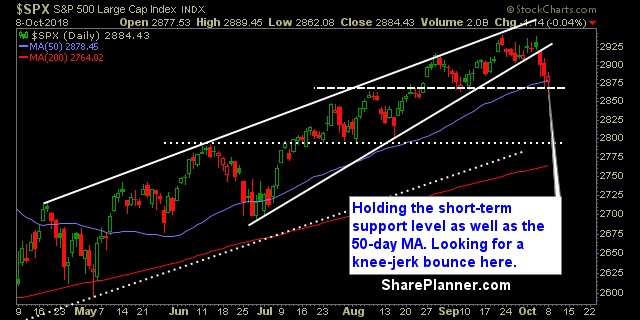
I’m coming into the day with one long position to see whether the bulls can follow through on yesterday’s bounce and hold of the 50-day moving average as well as the hammer candle it managed to form. If the market turns bullish today, I may consider adding one additional long position.
Indicators
- Volatility Index (VIX) – Spiked as high at 18.38, but couldn’t hold the majority of its gains during the market rally, dropping back down to 15.69 and a nasty shooting star candle, indicating additional downside for the VIX.
- T2108 (% of stocks trading above their 40-day moving average): Strong candle for the indicator, rallying 4% yesterday to 32%. Also could be looking at the least, a dead cat bounce here.
- Moving averages (SPX): Broke the 50-day moving average, intraday, again but managed to close above it by the close. Second day in a row that has happened, and putting together some support there.
- RELATED: Patterns to Profits: Training Course
Sectors to Watch Today
Utilities with a massive two-week rally and breaking out, while Staples finally showed signs of life here, despite still looking like a rollover on the daily chart. Financials bounced, but still a sideways trading pattern. Telecom pulled back nicely to the 50-day moving average, and may be ready to bounce in its rising uptrend. Bull flag in the Energy sector. Technology is very oversold. 
My Market Sentiment
The bulls have managed to test, break, and then recover to the 50-day moving average, two straight days now. It is setting up for a bounce off of it, to squeeze the shorts. However, the futures are pointing lower, which could very likely result in another break of the 50-day MA again, today.
S&P 500 Technical Analysis
Current Stock Trading Portfolio Balance
- 1 Long Position


Welcome to Swing Trading the Stock Market Podcast!
I want you to become a better trader, and you know what? You absolutely can!
Commit these three rules to memory and to your trading:
#1: Manage the RISK ALWAYS!
#2: Keep the Losses Small
#3: Do #1 & #2 and the profits will take care of themselves.
That’s right, successful swing-trading is about managing the risk, and with Swing Trading the Stock Market podcast, I encourage you to email me (ryan@shareplanner.com) your questions, and there’s a good chance I’ll make a future podcast out of your stock market related question.
In this podcast episode, Ryan discusses how really bad, losing trades in the stock market creates an impossible scenario for the trader in terms of what the right decision should be.
Be sure to check out my Swing-Trading offering through SharePlanner that goes hand-in-hand with my podcast, offering all of the research, charts and technical analysis on the stock market and individual stocks, not to mention my personal watch-lists, reviews and regular updates on the most popular stocks, including the all-important big tech stocks. Check it out now at: https://www.shareplanner.com/premium-plans
📈 START SWING-TRADING WITH ME! 📈
Click here to subscribe: https://shareplanner.com/tradingblock
— — — — — — — — —
💻 STOCK MARKET TRAINING COURSES 💻
Click here for all of my training courses: https://www.shareplanner.com/trading-academy
– The A-Z of the Self-Made Trader –https://www.shareplanner.com/the-a-z-of-the-self-made-trader
– The Winning Watch-List — https://www.shareplanner.com/winning-watchlist
– Patterns to Profits — https://www.shareplanner.com/patterns-to-profits
– Get 1-on-1 Coaching — https://www.shareplanner.com/coaching
— — — — — — — — —
❤️ SUBSCRIBE TO MY YOUTUBE CHANNEL 📺
Click here to subscribe: https://www.youtube.com/shareplanner?sub_confirmation=1
🎧 LISTEN TO MY PODCAST 🎵
Click here to listen to my podcast: https://open.spotify.com/show/5Nn7MhTB9HJSyQ0C6bMKXI
— — — — — — — — —
💰 FREE RESOURCES 💰
— — — — — — — — —
🛠 TOOLS OF THE TRADE 🛠
Software I use (TC2000): https://bit.ly/2HBdnBm
— — — — — — — — —
📱 FOLLOW SHAREPLANNER ON SOCIAL MEDIA 📱
FACEBOOK: https://facebook.com/shareplanner
*Disclaimer: Ryan Mallory is not a financial adviser and this podcast is for entertainment purposes only. Consult your financial adviser before making any decisions.
You Might Like

South Korea: The Hidden Driver of US Tech Volatility

Stop Trying to Hit Home Runs: Start Trading Within Your Means

How to Trade Breakouts Without Getting Trapped