
Tuesday’s swing-trades: Take a look at three trading ideas to prep you for the next trading session. Get all of my trades that I make real-time by jumping in the Splash Zone and start making some profits for yourself! Long Yandex (YNDX)

The bulls aren’t giving up much ground today, and it appears like today’s price action is more of a pause in the current rally than anything to be concerned with, as it pertains to market reversals. Below you will find my weekly list of swing trades that I am watching. Of course I’ll be adding
My Swing Trading Approach I am willing to add a new position to the portfolio today, but I have to be extremely “choosy” with my opportunities here, because the market is overbought, and I have little desire to add more exposure at the tail end, before seeing a normal market pullback. Indicators
Monday’s swing-trades: Take a look at three trading ideas to prep you for the next trading session. Get all of my trades that I make real-time by jumping in the Splash Zone and start making some profits for yourself! Long Weight Watchers (WTW)

I know there are a lot of frustrated swing traders out there. I know that trading high volatility markets hasn’t been easy for most traders. I get that. The headline risk is insane, we are in the winding up earnings season, tariffs are in play, the market has the feel of being on the tail
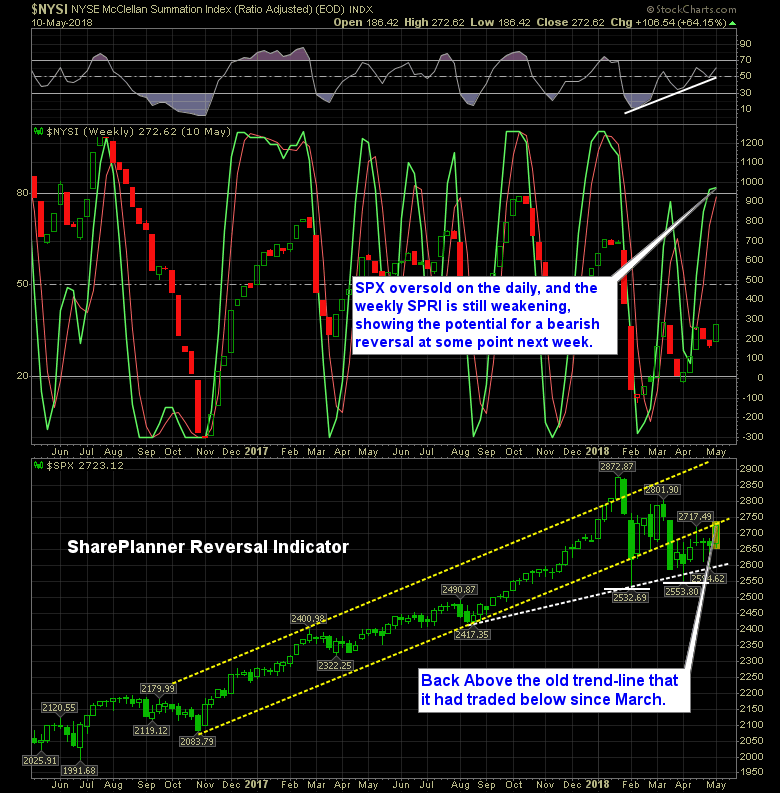
Overall the week has been a good one for the market, and it’s much needed, following its flirtation last week of a break of the 200-day moving average (SPX). Honestly, I thought this week’s rally would have fixed a somewhat problematic trend developing in the SharePlanner Reversal Indicator, but it didn’t. Instead, the slight bend

My Swing Trading Approach I’m not opposed to adding more long exposure, but may wait for some consolidation in price or a light volume pullback first. Indicators

Friday’s swing-trades: Take a look at three trading ideas to prep you for the next trading session. Get all of my trades that I make real-time by jumping in the Splash Zone and start making some profits for yourself! Long Oil States International (OIS)
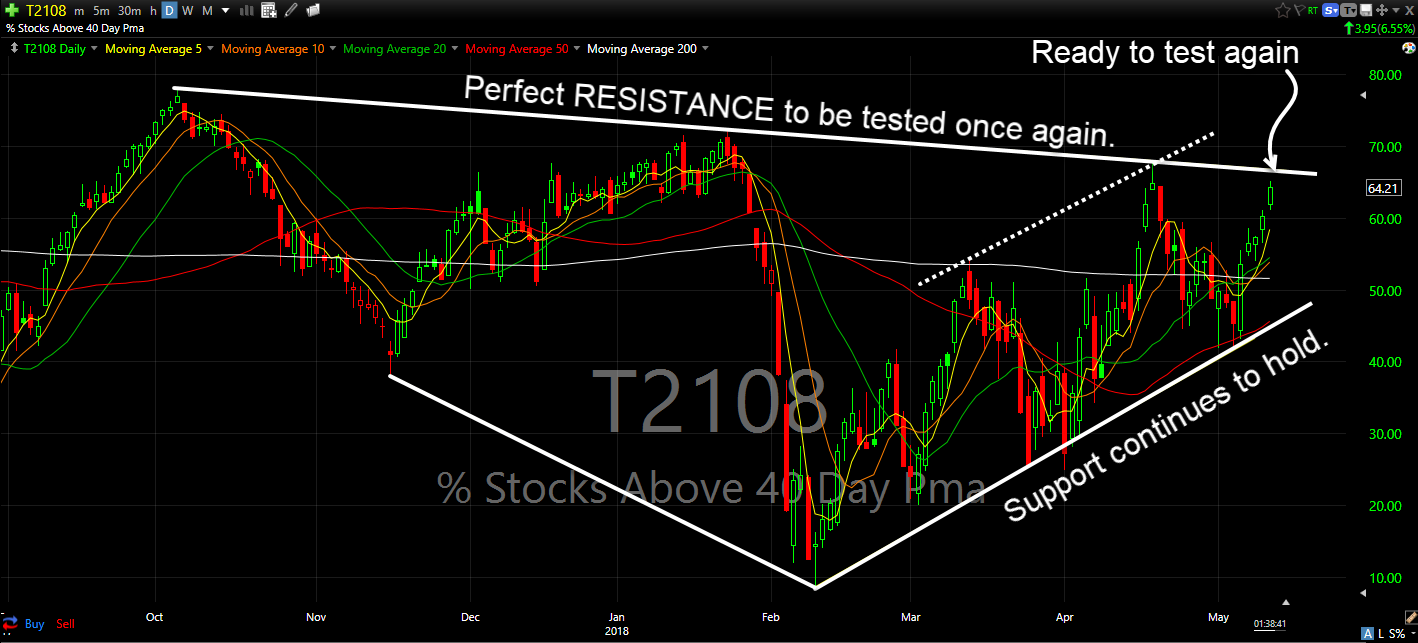
I’m not a huge fan of using technical analysis on indicators, particularly when the y-axis on the chart is a percentage basis capped at 100%. But this T2108 chart, I believe has some merit as it pertains to support and resistance. For those needing a refresher, the T2108 measures the percentage of stocks trading above

My Swing Trading Approach I am following the downtrend that the bulls are testing at the open today on SPX. Should it break, I will look to steadily increase my long exposure in the market, while protecting my profits in existing positions. Indicators

spc@shareplanner.com
(904) 800-8420
© Copyright 2025 | SharePlanner Inc. All Rights Reserved.
Disclaimer: The information provided on this website is for educational and informational purposes only. Ryan Mallory and/or SharePlanner are not licensed financial advisors, brokers, or tax professionals. The content on this site should not be considered as financial, investment, tax, or legal advice.
All information and opinions expressed herein are based on sources believed to be accurate and reliable. However, we make no representation or warranty as to their accuracy, completeness, or reliability. Any action you take upon the information on this website is strictly at your own risk.
Past performance is not indicative of future results. Investing involves risk, including the possible loss of principal. All investors should make their own decisions based on their specific investment objectives and financial circumstances.
This site may contain links to external websites that are not provided or maintained by or in any way affiliated with Ryan Mallory and/or SharePlanner. Please note that Ryan Mallory and/or SharePlanner do not guarantee the accuracy, relevance, timeliness, or completeness of any information on these external websites.
By using this website, you agree that Ryan Mallory and/or SharePlanner and any affiliated parties are not responsible for any losses or damages resulting from your use of or reliance on the information provided.
It is strongly recommended that you consult with a qualified professional before making any financial decisions.