Bulls got this market ripping higher again after last week’s non-responsive price action that was deemed dead on arrival. New all-time highs have been established and S&P 500 (SPX) is only a cool 7 points away from 2200. Lots can happen when SPX hit 2200. There is no doubt plenty of people that have
It is a new month and the market behavior today is acting as if it wants nothing to do with the gains seen last month. That wouldn’t be surprising either considering that August is the worst month of the year, historically, for the Dow and S&P 500. As a result, I don’t have huge levels
This week is going to be a challenge for traders – there is no doubt about it. Regardless of whether the market finishes higher or lower on the week, you have the biggest weak of earnings where tons of big names are reporting their results, followed by the Fed’s FOMC Statement on Wednesday, and GDP
The bulls are trying to start the week off right, with more upside. This is despite the failed coup attempt in Turkey over the weekend and more law enforcement officers being killed domestically. The latter hasn’t mattered much to the market, nor has terrorist attacks within and outside US borders. I’m not stating an opinion

Technical Outlook: SPX finished lower for the first time after five straight green days. Futures following Friday’s close sunk on the failed coup attempt in Turkey. All those losses were erased with the opening print on Sunday night. 5-day moving average still holding strong on the current market rally. At this point, the market could

The bulls have it – barring an end of day sell-off, that takes price back below 2034 or worse, 2030, the bulls will have closed as new all-time highs (as long as it is above 2030, it is above all-time closing highs). To be shorting this market at this level, I don’t see why you

The SharePlanner Reversal Indicator on the weekly chart still suggests that there is strength still remaining in this market, but that the strength is starting to fade. Looking at the weekly below you can see how the slope of the SPRI is fading off to the right a bit there by flashing signals that the
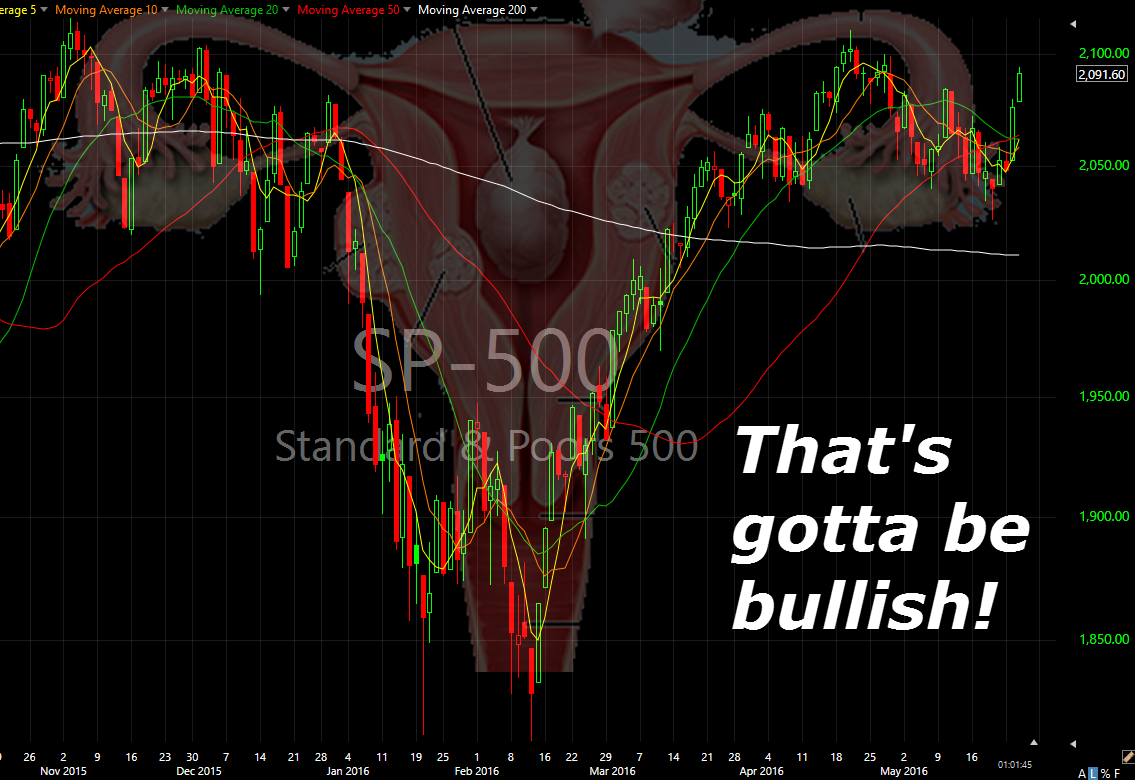
Yes, by some accounts, people will say this is a major inverse head and shoulders pattern. I disagree, what I believe this equates to is the ultra bullish female liberation breakout pattern that resembles, of course, the female anatomy. When I saw the chart, I couldn’t help but notice the obvious, and it helps to

You get the feeling that today is going to be yet another one of those trading sessions that you say to yourself, “I wish I could get back those 6.5 hours of trading!” Since the early ramp Friday morning, the market has been insanely dull and boring and today is doing little to change that
For those wondering when they should be taking profits on their oil trades, never fear, Dennis Gartman just went bullish on crude. For those who are not aware, this is the individual who has a track record of being the most perfect contrarian indicator that our generation has ever seen. Yes, Jim Cramer was

spc@shareplanner.com
(904) 800-8420
© Copyright 2025 | SharePlanner Inc. All Rights Reserved.
Disclaimer: The information provided on this website is for educational and informational purposes only. Ryan Mallory and/or SharePlanner are not licensed financial advisors, brokers, or tax professionals. The content on this site should not be considered as financial, investment, tax, or legal advice.
All information and opinions expressed herein are based on sources believed to be accurate and reliable. However, we make no representation or warranty as to their accuracy, completeness, or reliability. Any action you take upon the information on this website is strictly at your own risk.
Past performance is not indicative of future results. Investing involves risk, including the possible loss of principal. All investors should make their own decisions based on their specific investment objectives and financial circumstances.
This site may contain links to external websites that are not provided or maintained by or in any way affiliated with Ryan Mallory and/or SharePlanner. Please note that Ryan Mallory and/or SharePlanner do not guarantee the accuracy, relevance, timeliness, or completeness of any information on these external websites.
By using this website, you agree that Ryan Mallory and/or SharePlanner and any affiliated parties are not responsible for any losses or damages resulting from your use of or reliance on the information provided.
It is strongly recommended that you consult with a qualified professional before making any financial decisions.