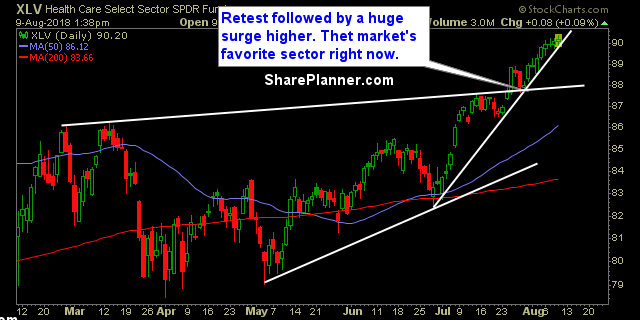
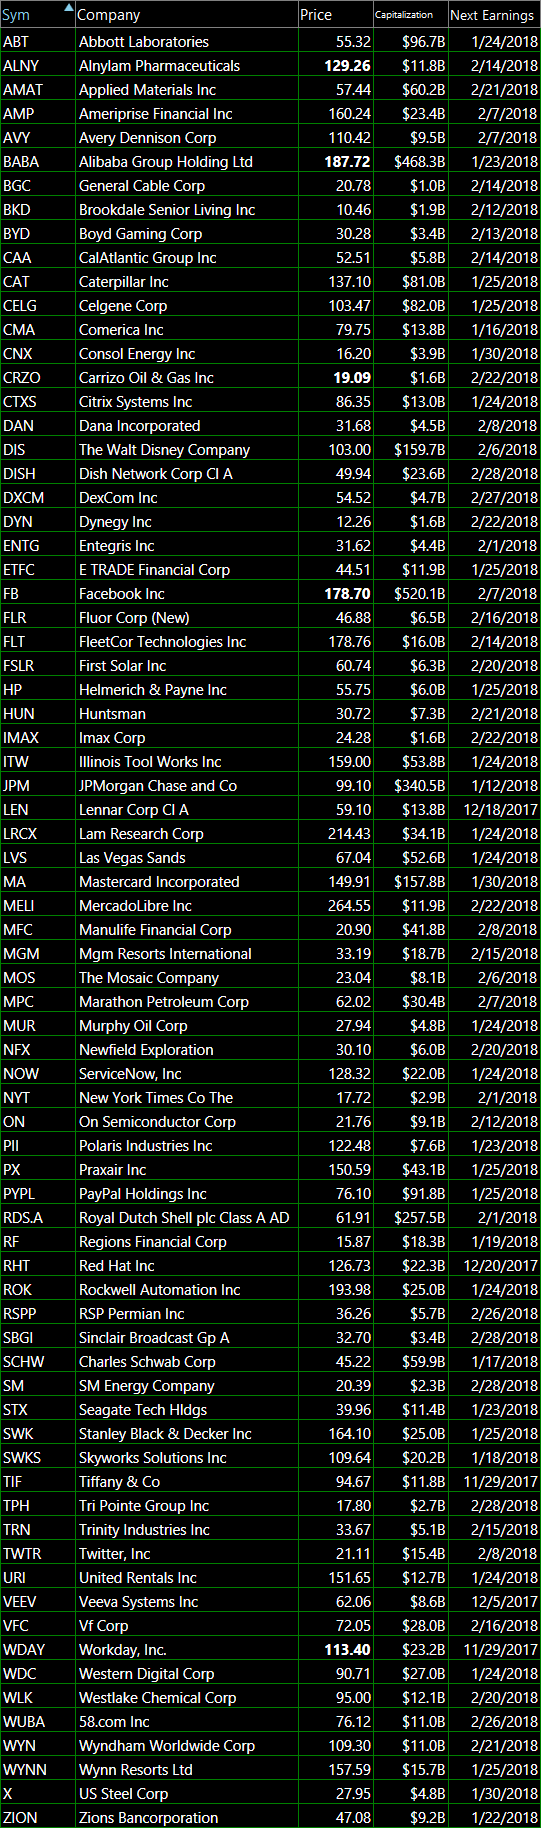
Most of the sectors are showing sideways trading patterns. The market isn't entirely untradeable but it is getting pretty darn close to it. I'm finding the breakout plays to be more difficult than most, and instead focusing on the stocks that are forming a base and coming out of that base, following a sell-off. Most
My reversal indicator is still providing me with a very strong bullish reading. As a result, I remain bullish on the market as a whole, but in a tepid fashion. I’m not going out and buying everything I set my eyes on, in fact, I am trying to stay away, as much as possible from
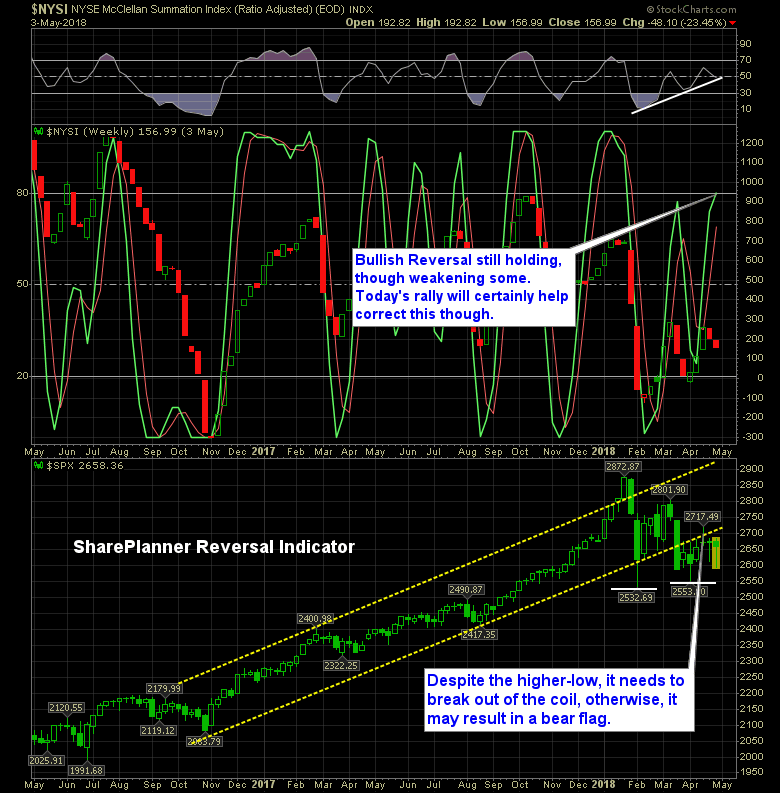
This has not been a good week for the bulls. They have fully lost control of the market. When I pulled up the SharePlanner Reversal Indicator, I fully expected it to show a bearish reversal in the works, but it is still riding strong to the upside. Of course, it hasn’t priced today’s action just
Bulls are off to a solid start for 2018 with a solid rally. Not a major rally, but considering the sell-off that concluded 2017, there was some pause among traders as to whether the selling would carry over into the new year.
Alright, it might sound humorous in saying this, but the SharePlanner Reversal Indicator just flashed a bullish reversal signal. But hasn’t the market been in bull mode all year long?
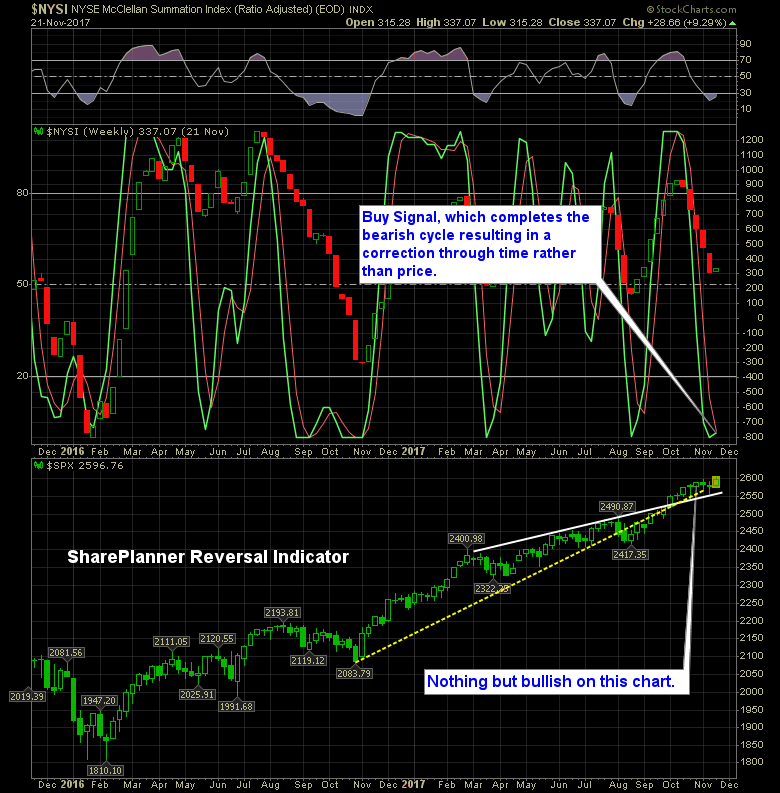
S&P 500 is off to a respectable start on the most bullish week of the trading year. Historically, Thanksgiving tends to be a good week for traders. Low volume, but by-and-large, it tends to perform most consistently to the upside than any other trading week of the year.
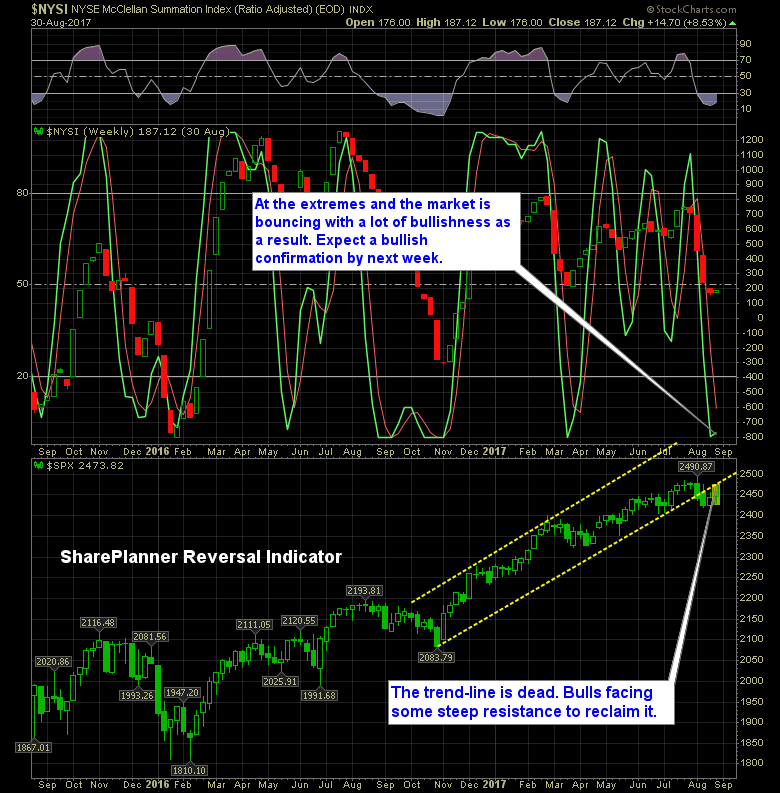
The SharePlanner Reversal Indicator is lighting up with green. After a good solid month of August where price action spent most of its time in the red, the last three days have been uber-bullish for the S&P 500 (SPX) and may even finish in the green to close out the month, which would really be
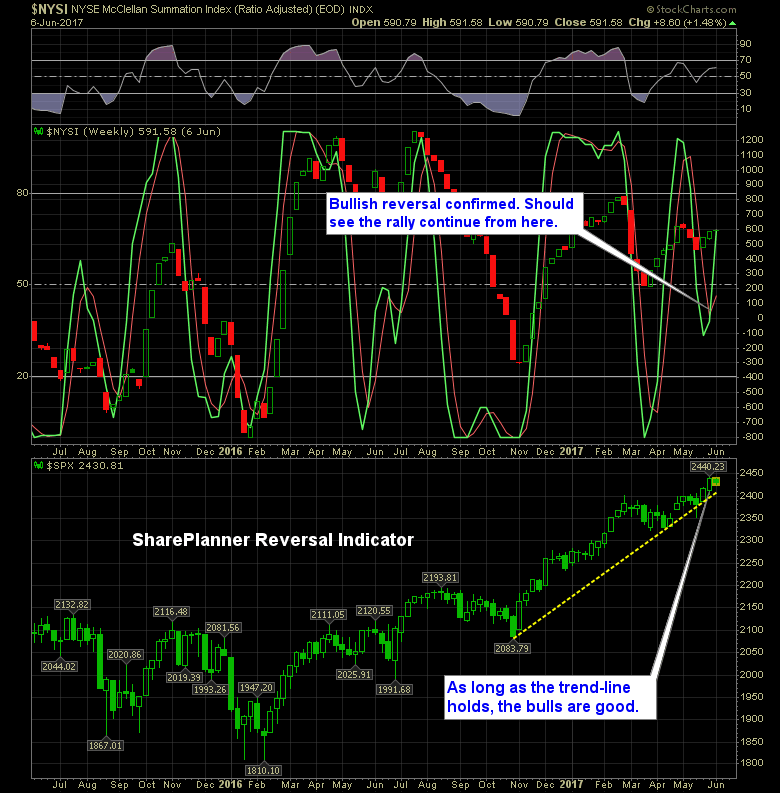
The bulls have a change in the reversal indicator Up until this week, the SharePlanner Reversal Indicator, had been pointing lower, but if you remember last week, I mentioned that we would probably get a bullish signal on the reversal indicator.

Technical Outlook: Yes, for an 8th straight day, the S&P 500 (SPX) sold off. The expectation of a bounce is strong here, and quite surprising we haven’t even seen any significant attempts at it yet. Last time SPX was down 8 straight days was in 2008. The most troubling aspect of this decline is how light it

Technical Outlook: The whipsaw price action in S&P 500 (SPX) continued yesterday with a hard bounce following two days of selling. The price action is sporadic and unpredictable at this juncture. Very topsy-turvy – Last Thursday you had a bullish break above recent consolidation. Following Monday’s price action, you had a bear flag pattern playing

spc@shareplanner.com
(904) 800-8420
© Copyright 2025 | SharePlanner Inc. All Rights Reserved.
Disclaimer: The information provided on this website is for educational and informational purposes only. Ryan Mallory and/or SharePlanner are not licensed financial advisors, brokers, or tax professionals. The content on this site should not be considered as financial, investment, tax, or legal advice.
All information and opinions expressed herein are based on sources believed to be accurate and reliable. However, we make no representation or warranty as to their accuracy, completeness, or reliability. Any action you take upon the information on this website is strictly at your own risk.
Past performance is not indicative of future results. Investing involves risk, including the possible loss of principal. All investors should make their own decisions based on their specific investment objectives and financial circumstances.
This site may contain links to external websites that are not provided or maintained by or in any way affiliated with Ryan Mallory and/or SharePlanner. Please note that Ryan Mallory and/or SharePlanner do not guarantee the accuracy, relevance, timeliness, or completeness of any information on these external websites.
By using this website, you agree that Ryan Mallory and/or SharePlanner and any affiliated parties are not responsible for any losses or damages resulting from your use of or reliance on the information provided.
It is strongly recommended that you consult with a qualified professional before making any financial decisions.