
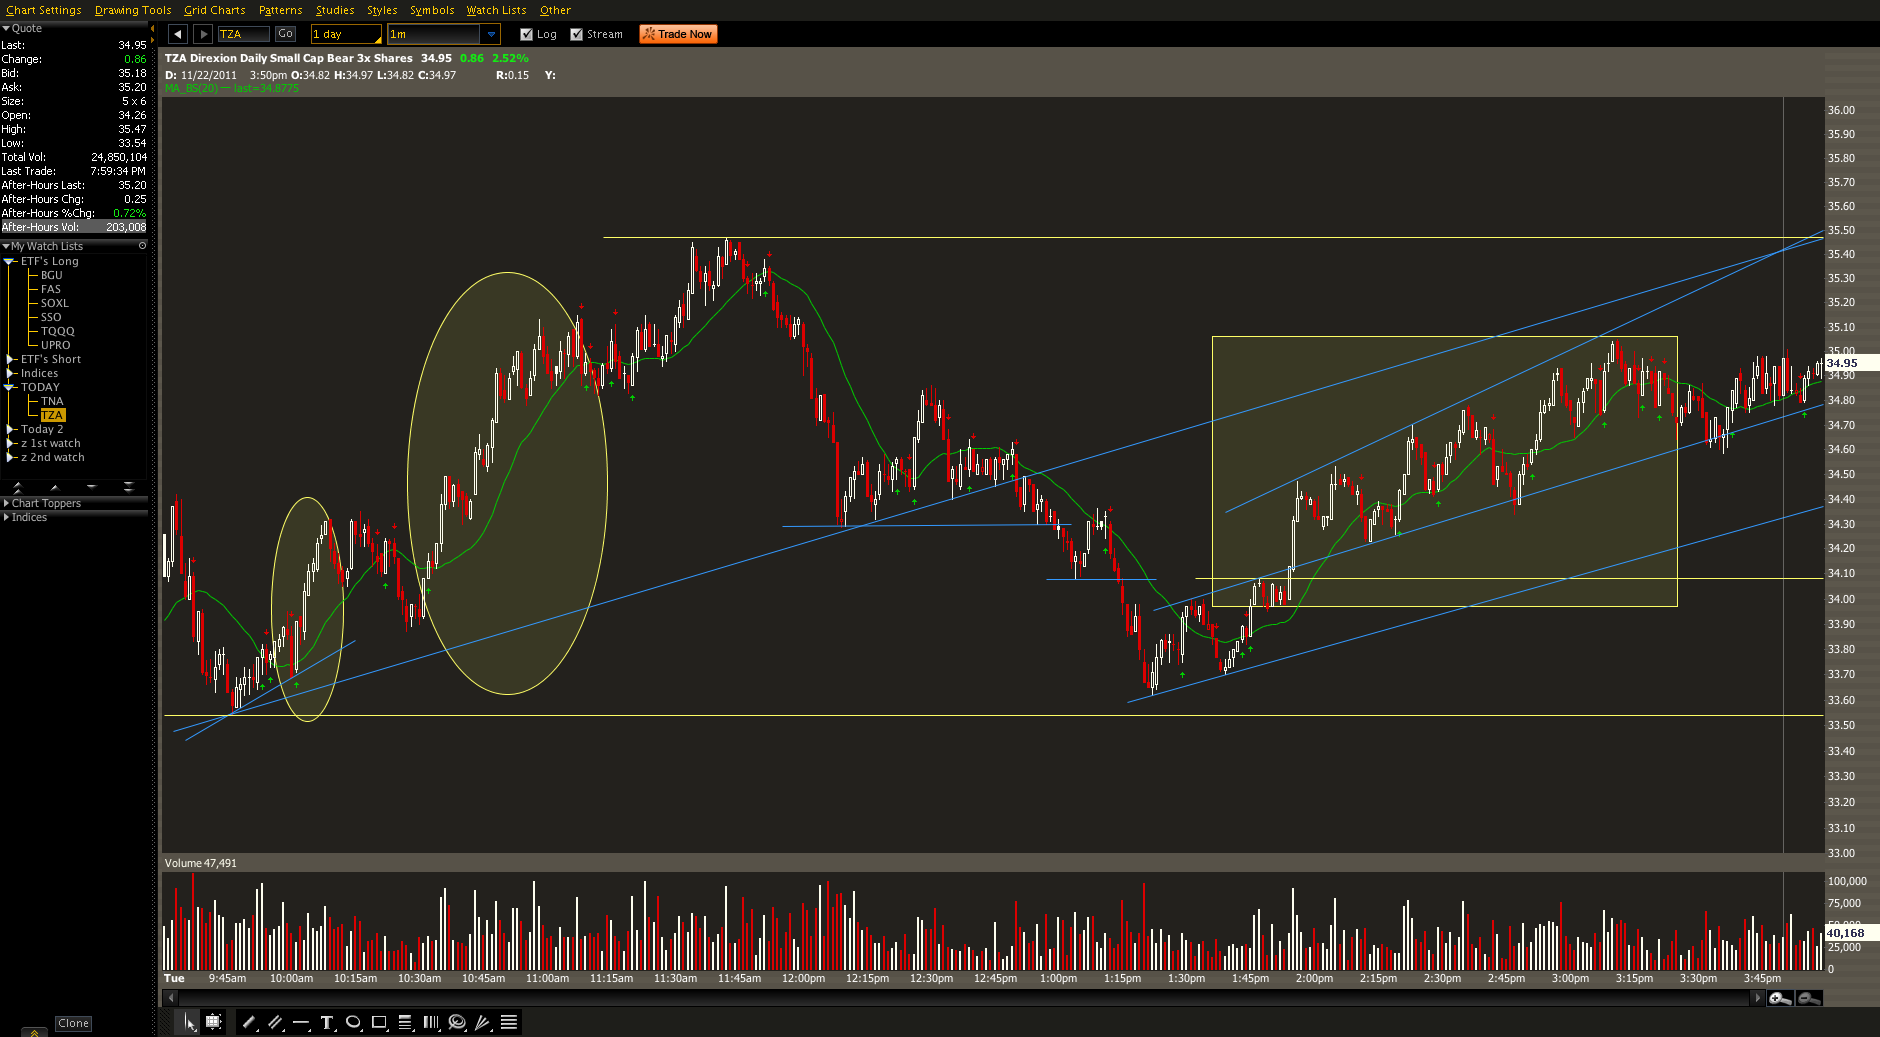
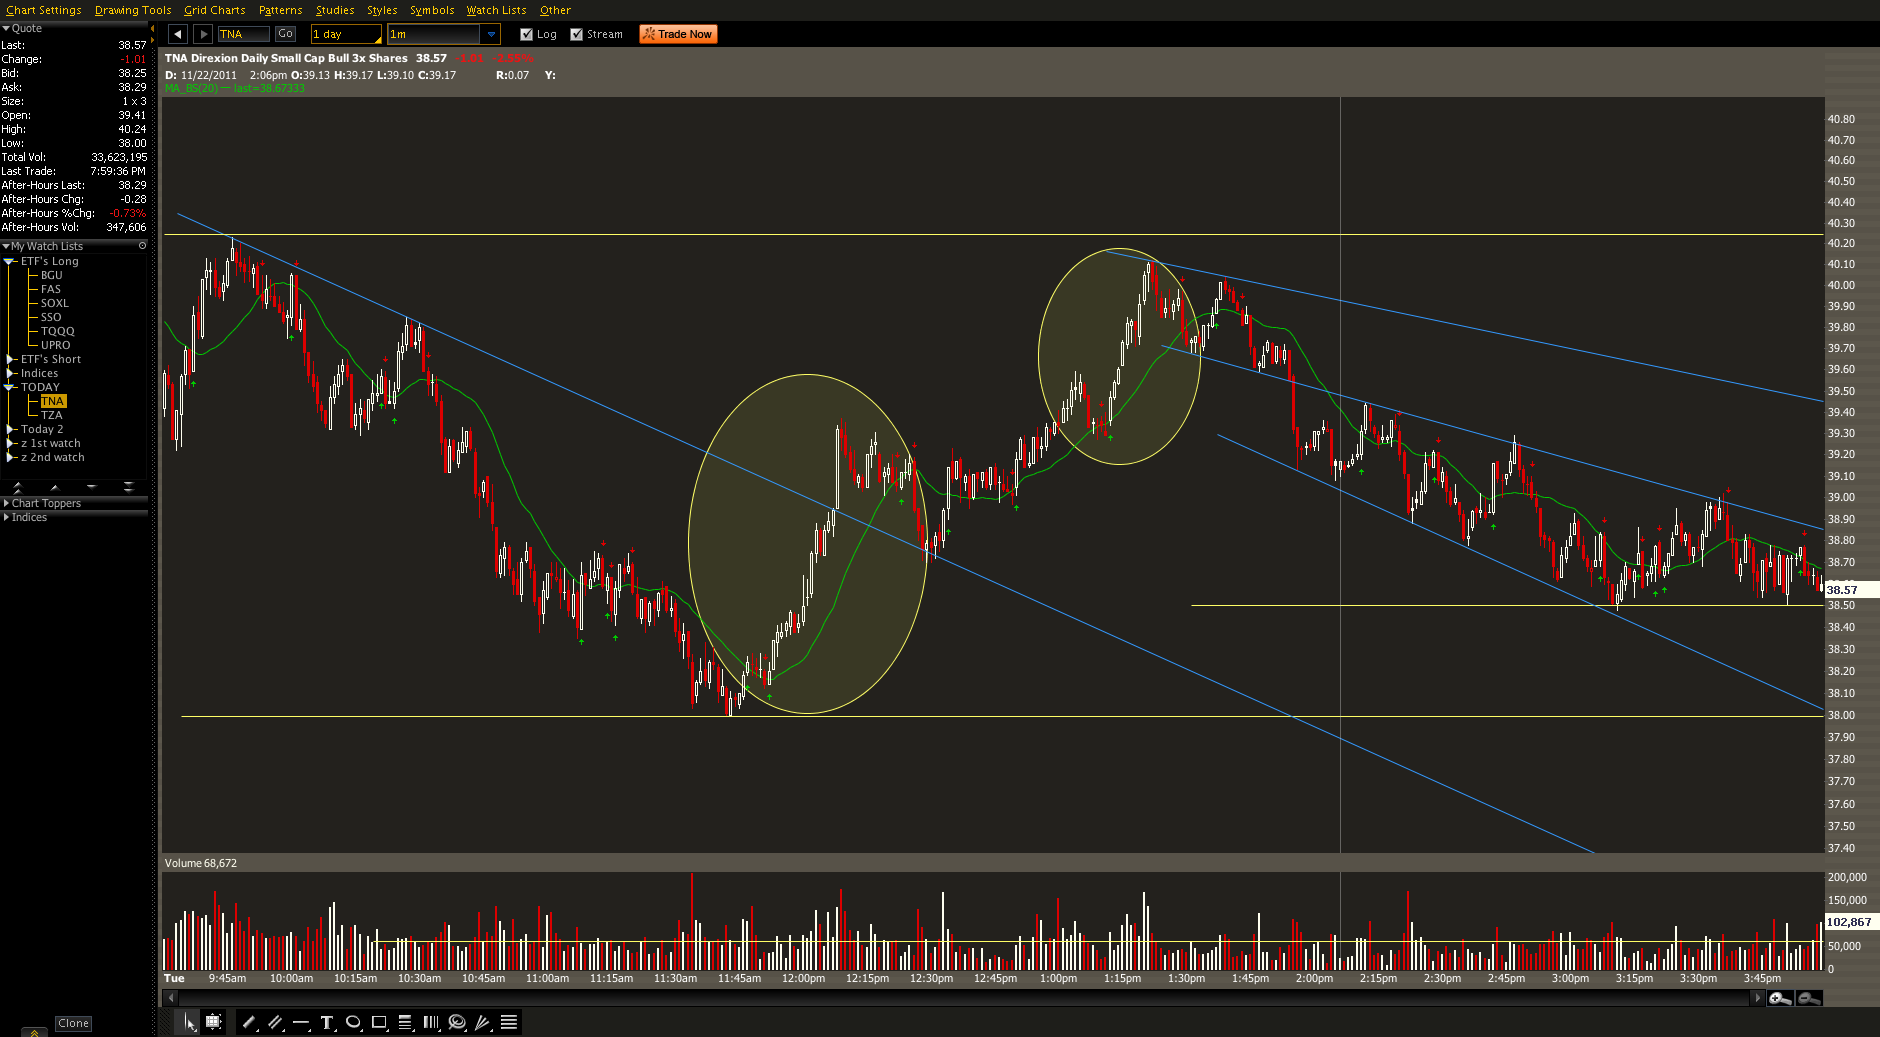
Here’s a look back at TNA and TZA for monday nov 22, 2011. As some of you know this is the only thing that I am currently day trading with as I like the leveraging that it provides.
Some of you have asked how I make my trades. While it’s a hard question to answer right now, I’ll try my best…i’m still new to it and learning every day.
I like to wait until at least the 10 or 10:30 area to see what kind of trend we are establishing. Many times we are either going to continue with that trend or we will see the start of another. Either way I’ll try to do as much charting as possible. The charts below are a much more modified version of my charting. At the end of the day my charts are extremely confusion looking….many support levels drawn, etc. But they make sense at the time. I’m only interesting in trading in the trend…meaning…if we are in a downtrend I’m looking for spots to get in on TZA, not spots to ride up TNA. Trying to play bounces the opposite of the current trend can be deadly and spotty at best. Note: I’m finding usually about 2-3 moves in each stock per day. Currently I’m trading much more than that, but I would like to bring my trades down to about 6 per day.
I’m also very closely watching the 20 day moving average on a one minute chart. I personally have liked the one minute because I like the detail that it provides and gives me a micro picture of the movement rather than macro. These stocks are so leveraged that for the, sometimes little moves I get, I want to have as much information as possible. As you can see by the highlighted sections the 20 day moving average comes in handy for both entries and exits. Of course candle size is also in play. Note: i am finding that very often a buy indication given by the 20 day, followed immediately by a sell indication can be a very bearish sign. Or reverse for bullish.
I don’t know…i’m not trying to make this complicated, or say that this is a holy grail…it’s not. But so far I’ve had 5 winning days. You have to do your charting, find your trendlines (look at some of those bounces off trendlines in these charts!) and pick your spots for entry using the 20 day.
Many times I get in a trade and somewhat like it but am not happy with how the candle is forming even though I’m in profit and I will get out quick. I’ve protected many a profits this way. This is not the kind of ETF you want to fool around with if you aren’t in a big move. I’ve been in and out as fast as 13 seconds. This is another reason why it’s very hard for me to post my moves. I’m way too busy charting and closely watching my account. These things will turn on a dime and you have to be very protective, many times I have my buy or sell order pulled up ready to go at a quick moment.
But keep your ibuprofren nearby.


Welcome to Swing Trading the Stock Market Podcast!
I want you to become a better trader, and you know what? You absolutely can!
Commit these three rules to memory and to your trading:
#1: Manage the RISK ALWAYS!
#2: Keep the Losses Small
#3: Do #1 & #2 and the profits will take care of themselves.
That’s right, successful swing-trading is about managing the risk, and with Swing Trading the Stock Market podcast, I encourage you to email me (ryan@shareplanner.com) your questions, and there’s a good chance I’ll make a future podcast out of your stock market related question.
In this podcast episode, Ryan discusses how really bad, losing trades in the stock market creates an impossible scenario for the trader in terms of what the right decision should be.
Be sure to check out my Swing-Trading offering through SharePlanner that goes hand-in-hand with my podcast, offering all of the research, charts and technical analysis on the stock market and individual stocks, not to mention my personal watch-lists, reviews and regular updates on the most popular stocks, including the all-important big tech stocks. Check it out now at: https://www.shareplanner.com/premium-plans
📈 START SWING-TRADING WITH ME! 📈
Click here to subscribe: https://shareplanner.com/tradingblock
— — — — — — — — —
💻 STOCK MARKET TRAINING COURSES 💻
Click here for all of my training courses: https://www.shareplanner.com/trading-academy
– The A-Z of the Self-Made Trader –https://www.shareplanner.com/the-a-z-of-the-self-made-trader
– The Winning Watch-List — https://www.shareplanner.com/winning-watchlist
– Patterns to Profits — https://www.shareplanner.com/patterns-to-profits
– Get 1-on-1 Coaching — https://www.shareplanner.com/coaching
— — — — — — — — —
❤️ SUBSCRIBE TO MY YOUTUBE CHANNEL 📺
Click here to subscribe: https://www.youtube.com/shareplanner?sub_confirmation=1
🎧 LISTEN TO MY PODCAST 🎵
Click here to listen to my podcast: https://open.spotify.com/show/5Nn7MhTB9HJSyQ0C6bMKXI
— — — — — — — — —
💰 FREE RESOURCES 💰
— — — — — — — — —
🛠 TOOLS OF THE TRADE 🛠
Software I use (TC2000): https://bit.ly/2HBdnBm
— — — — — — — — —
📱 FOLLOW SHAREPLANNER ON SOCIAL MEDIA 📱
FACEBOOK: https://facebook.com/shareplanner
*Disclaimer: Ryan Mallory is not a financial adviser and this podcast is for entertainment purposes only. Consult your financial adviser before making any decisions.
You Might Like

South Korea: The Hidden Driver of US Tech Volatility

Stop Trying to Hit Home Runs: Start Trading Within Your Means

How to Trade Breakouts Without Getting Trapped