
I’ve been working on this trading strategy for a while now, but really started to focus on it solely in the past week. Here are some charts showing the moves and a brief explanation.
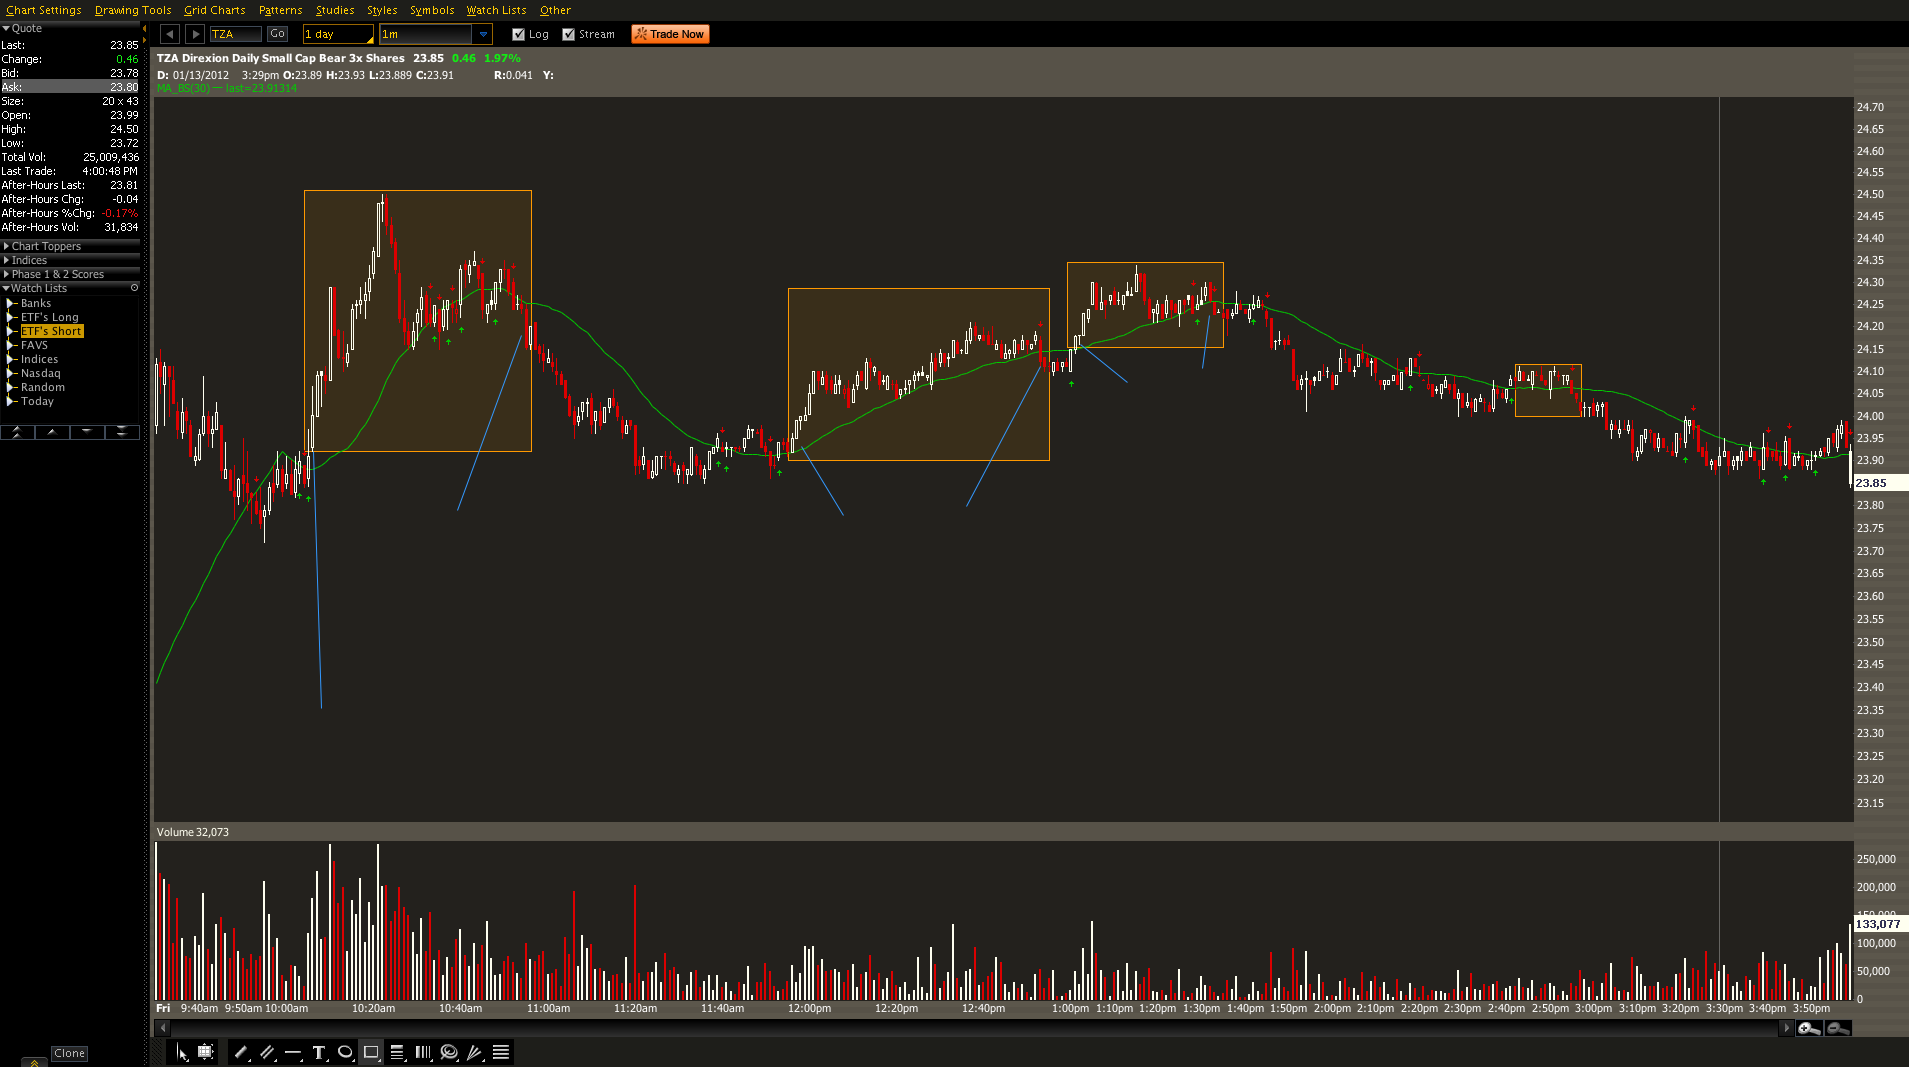
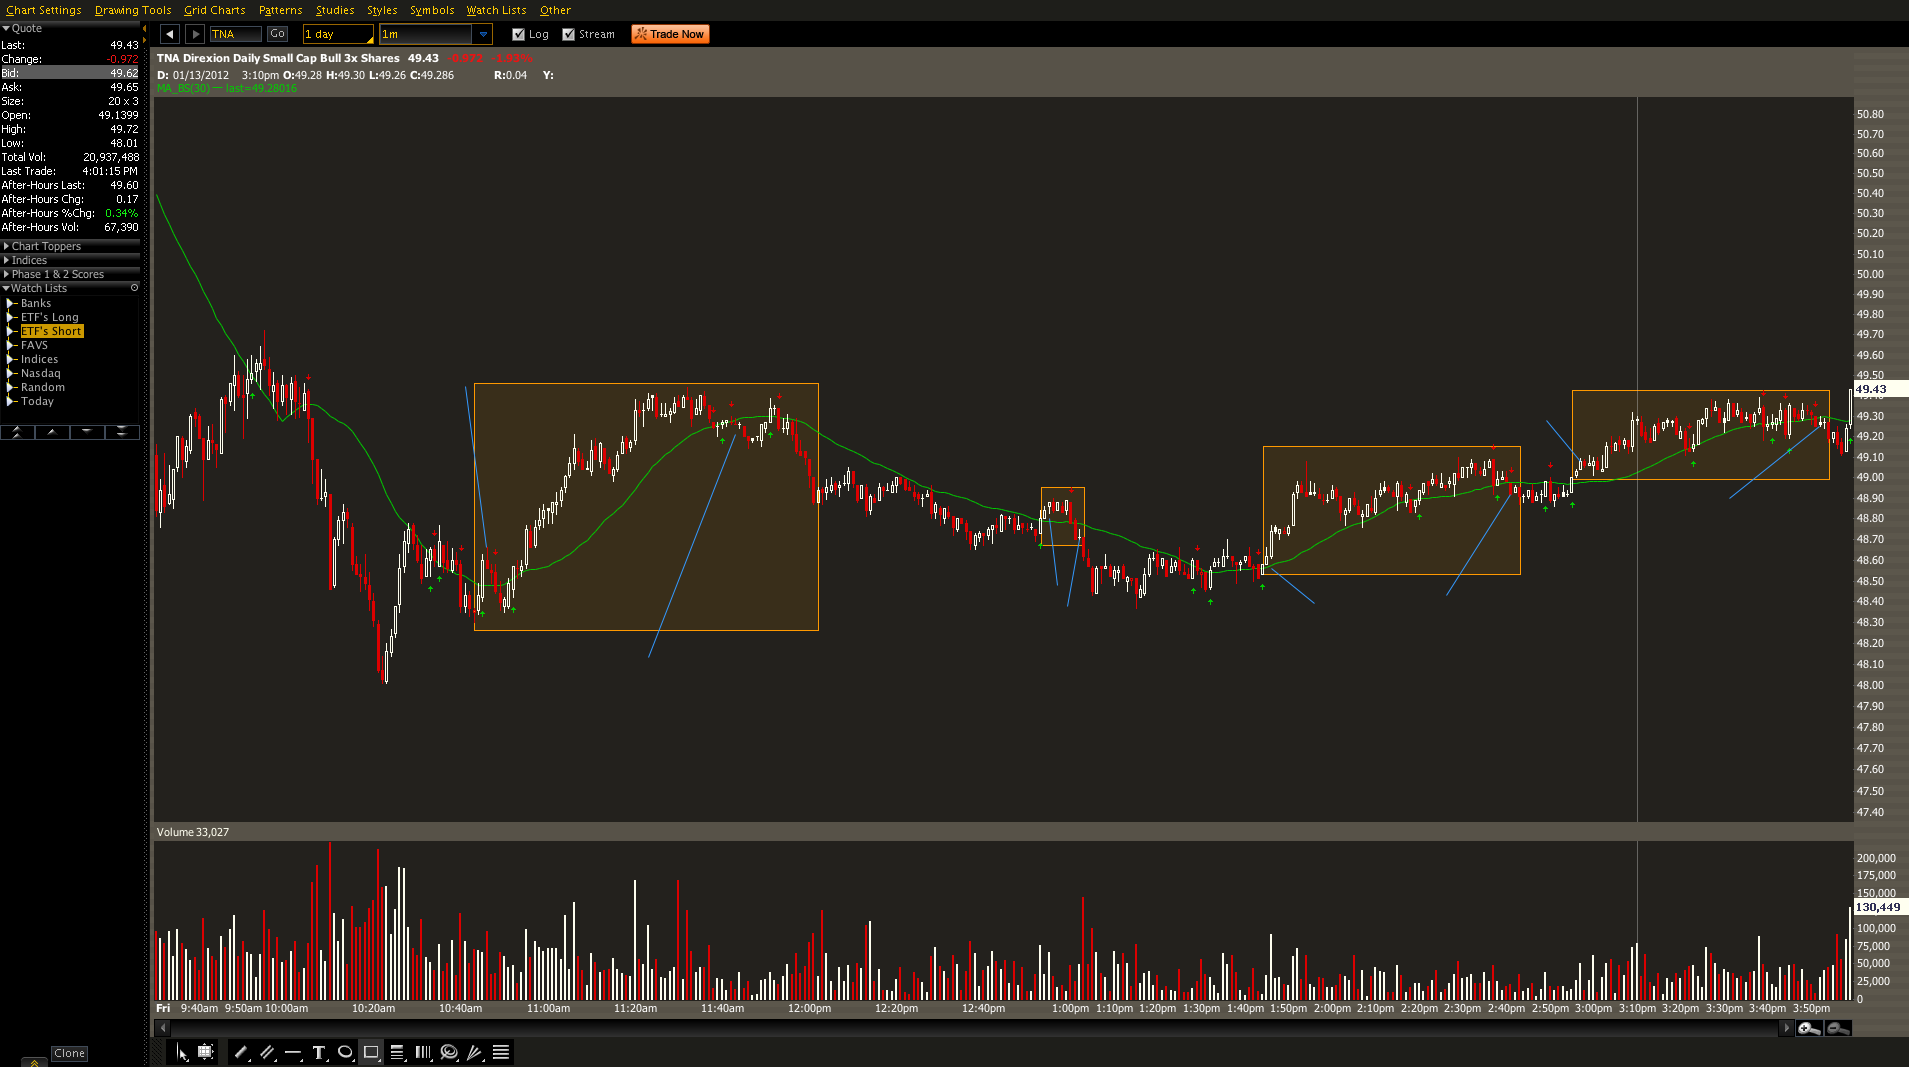
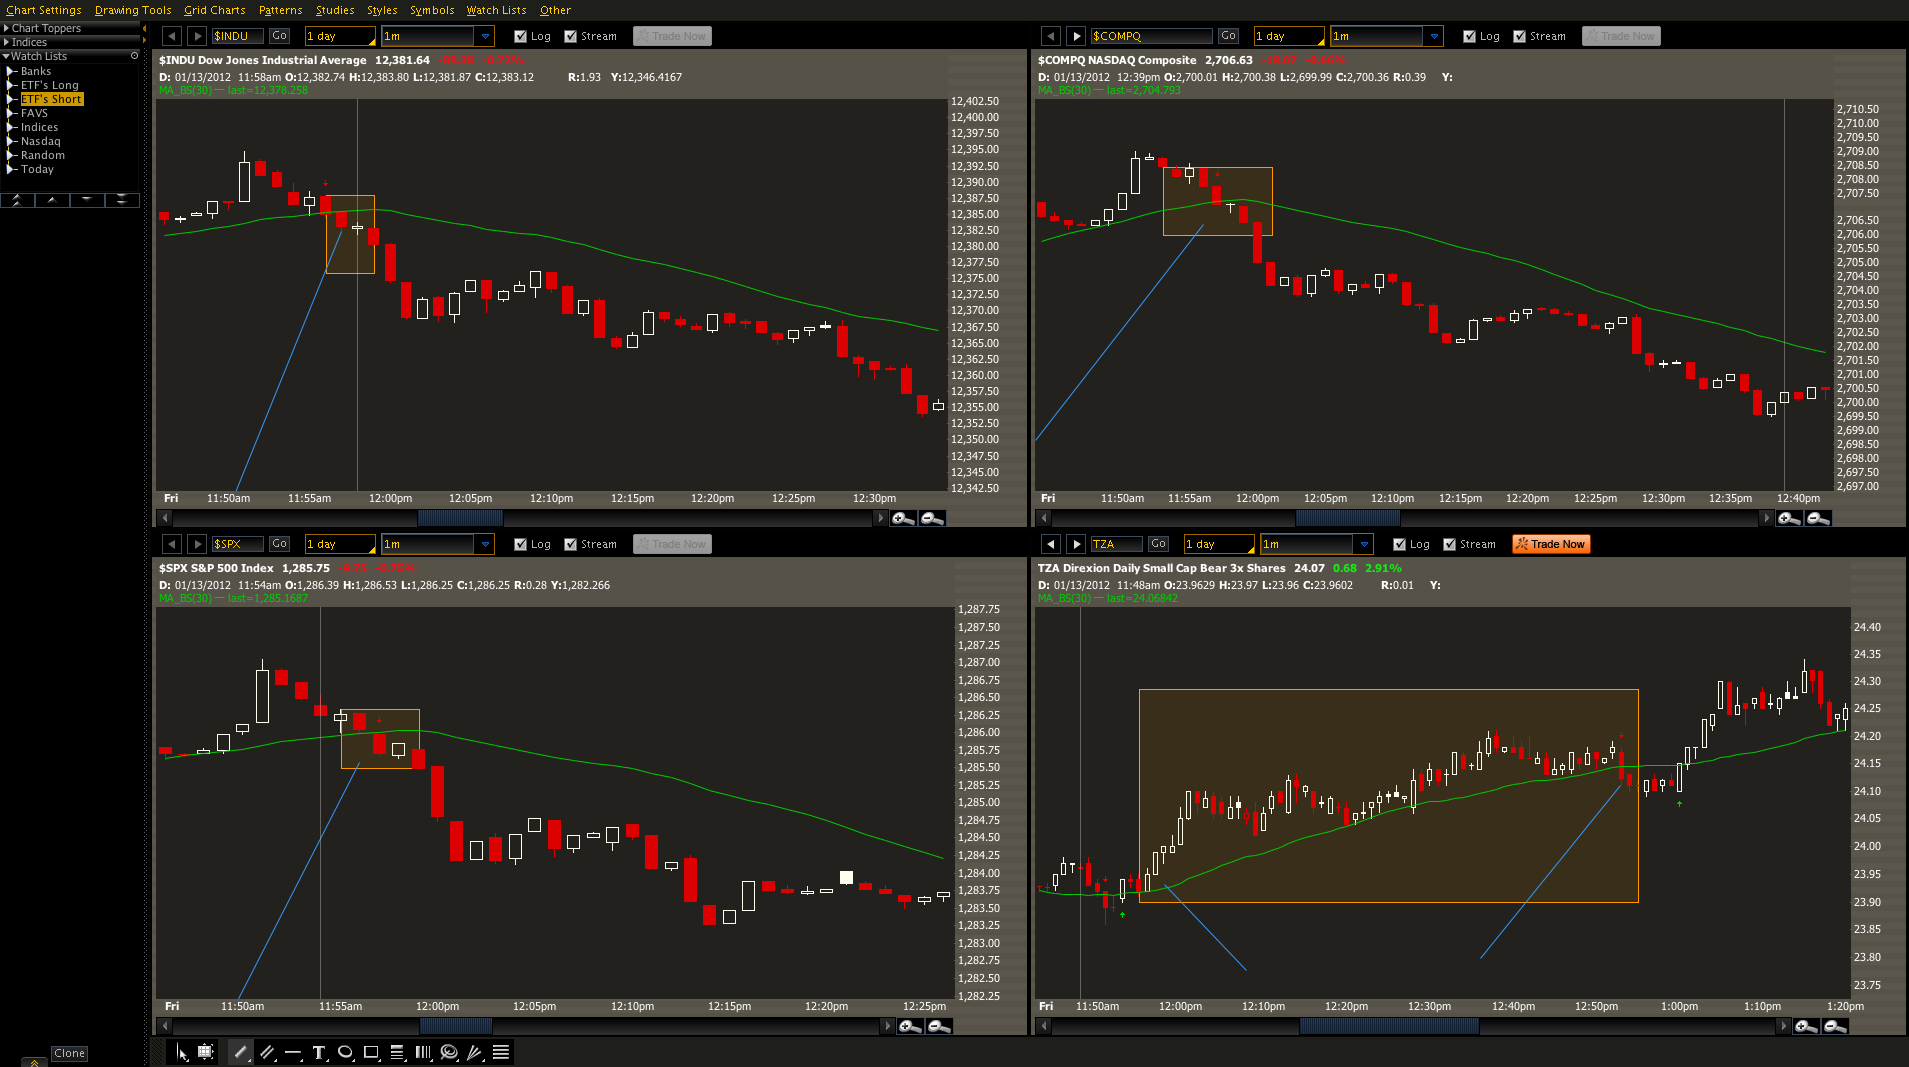
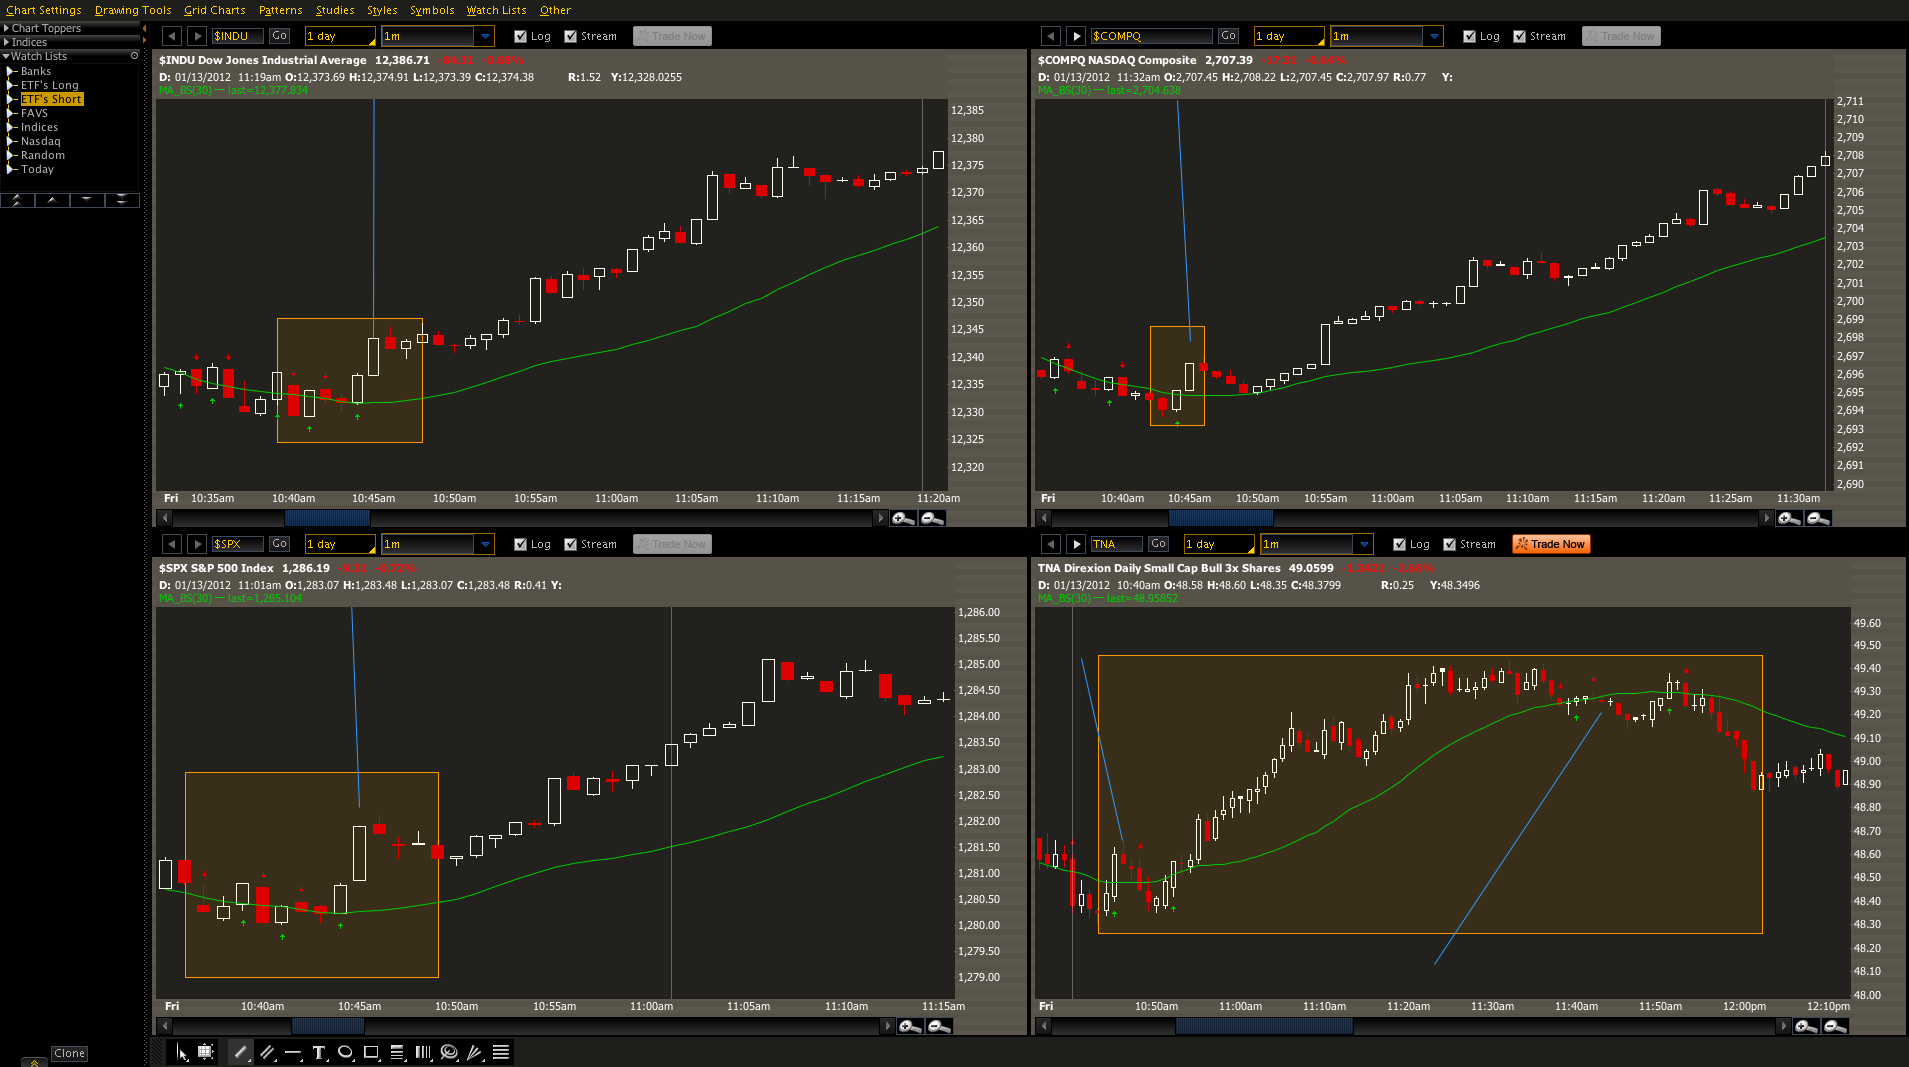
1. Have either 4 screens or set your 1 screen to 4 charts so that you can see them happening at the same time. The dow, nasdaq, sp500 and either tna or tza. All should be set to a 1 minute candle. The study used is the 30 day moving average.
2. The buy point is when all four charts have a FULL candle close above or below the 30MA. Or, for TZA, the other 3 have a candle closing below the 30MA and TZA has a candle closing above.
3. The sell point, in this case if the price movement moves opposite of what you want, is when the charts reverse and have candles in full close on the other side of the 30MA
4. However, if the price moves in your direction slowly lets say, wait until this reverse price action happens. If the price moves quickly, consider scaling the position out in 1/2’s or 1/3’s or 1/4’s. Because they are leveraged ETF’s they can reverse quickly on an otherwise profitable trade.
The charts below show the trades for today. There were 4 trades in both. Each had 3 winners and 1 loser.
Even in sideways trading days this can work out more times than not because of the amount of criteria that have to be met.
If anyone has any ideas on how to make this better please let me know. I’ll continue to chart them everyday and get an ongoing percentage of winners vs. losers.
It would take me a while here to notate all of the percentages for today, but visually you can get a good idea of profits and losses.
These show a couple charts and how the trades line up for the entry.


Welcome to Swing Trading the Stock Market Podcast!
I want you to become a better trader, and you know what? You absolutely can!
Commit these three rules to memory and to your trading:
#1: Manage the RISK ALWAYS!
#2: Keep the Losses Small
#3: Do #1 & #2 and the profits will take care of themselves.
That’s right, successful swing-trading is about managing the risk, and with Swing Trading the Stock Market podcast, I encourage you to email me (ryan@shareplanner.com) your questions, and there’s a good chance I’ll make a future podcast out of your stock market related question.
Watching the dollars rise and fall in your trading account can turn a well-planned swing trade into an emotional, deeply personal decision. In this episode, I explain why focusing on price action, percentage returns, and R-multiples can help you avoid cutting winners early, holding losers too long, and abandoning your trading plan.
Be sure to check out my Swing-Trading offering through SharePlanner that goes hand-in-hand with my podcast, offering all of the research, charts and technical analysis on the stock market and individual stocks, not to mention my personal watch-lists, reviews and regular updates on the most popular stocks, including the all-important big tech stocks. Check it out now at: https://www.shareplanner.com/premium-plans
📈 START SWING-TRADING WITH ME! 📈
Click here to subscribe: https://shareplanner.com/tradingblock
— — — — — — — — —
💻 STOCK MARKET TRAINING COURSES 💻
Click here for all of my training courses: https://www.shareplanner.com/trading-academy
– The A-Z of the Self-Made Trader –https://www.shareplanner.com/the-a-z-of-the-self-made-trader
– The Winning Watch-List — https://www.shareplanner.com/winning-watchlist
– Patterns to Profits — https://www.shareplanner.com/patterns-to-profits
– Get 1-on-1 Coaching — https://www.shareplanner.com/coaching
— — — — — — — — —
❤️ SUBSCRIBE TO MY YOUTUBE CHANNEL 📺
Click here to subscribe: https://www.youtube.com/shareplanner?sub_confirmation=1
🎧 LISTEN TO MY PODCAST 🎵
Click here to listen to my podcast: https://open.spotify.com/show/5Nn7MhTB9HJSyQ0C6bMKXI
— — — — — — — — —
💰 FREE RESOURCES 💰
— — — — — — — — —
🛠 TOOLS OF THE TRADE 🛠
Software I use (TC2000): https://bit.ly/2HBdnBm
— — — — — — — — —
📱 FOLLOW SHAREPLANNER ON SOCIAL MEDIA 📱
*Disclaimer: Ryan Mallory is not a financial adviser and this podcast is for entertainment purposes only. Consult your financial adviser before making any decisions.

You Might Like

South Korea: The Hidden Driver of US Tech Volatility

Stop Trying to Hit Home Runs: Start Trading Within Your Means

How to Trade Breakouts Without Getting Trapped