
Traders often struggle to separate their feelings about a company from the reality of its stock price. It is easy to look at SoFi Technologies (SOFI) and see a disruptive fintech story. You might love the app or use the services and assume that means the stock should go up. But as swing traders, we cannot trade narratives or hope. We trade the price action in front of us.
Right now, the chart for SOFI is painting a clear picture, and it is not what bulls want to see. A combination of bearish patterns is flashing, and they often lead to lower prices. If you are holding and hoping for a turnaround, you need to take an honest look at the technical damage over the last few weeks. The market is telling us the path of least resistance is down.
In this post, I will walk you through what I am seeing on the charts, including the head and shoulders breakdown that confirmed in January and the bear flag forming now. More importantly, we will cover how to manage risk, because protecting capital is always job number one.
The Head and Shoulders Confirmation
The first major red flag for SOFI showed up at the end of January. The head and shoulders pattern is one of the most recognizable reversal structures in technical analysis. It suggests that an uptrend has exhausted itself and sellers are gaining control.
Now, it does not always play out cleanly. In strong bull markets, the neckline can act as a launchpad and invalidate the pattern quickly. But here is how it played out this time.
We saw the left shoulder form, followed by a higher high that created the head. Price pulled back, attempted to rally again, failed to reach the prior high, and formed the right shoulder. When the stock broke below the neckline, it confirmed the reversal.
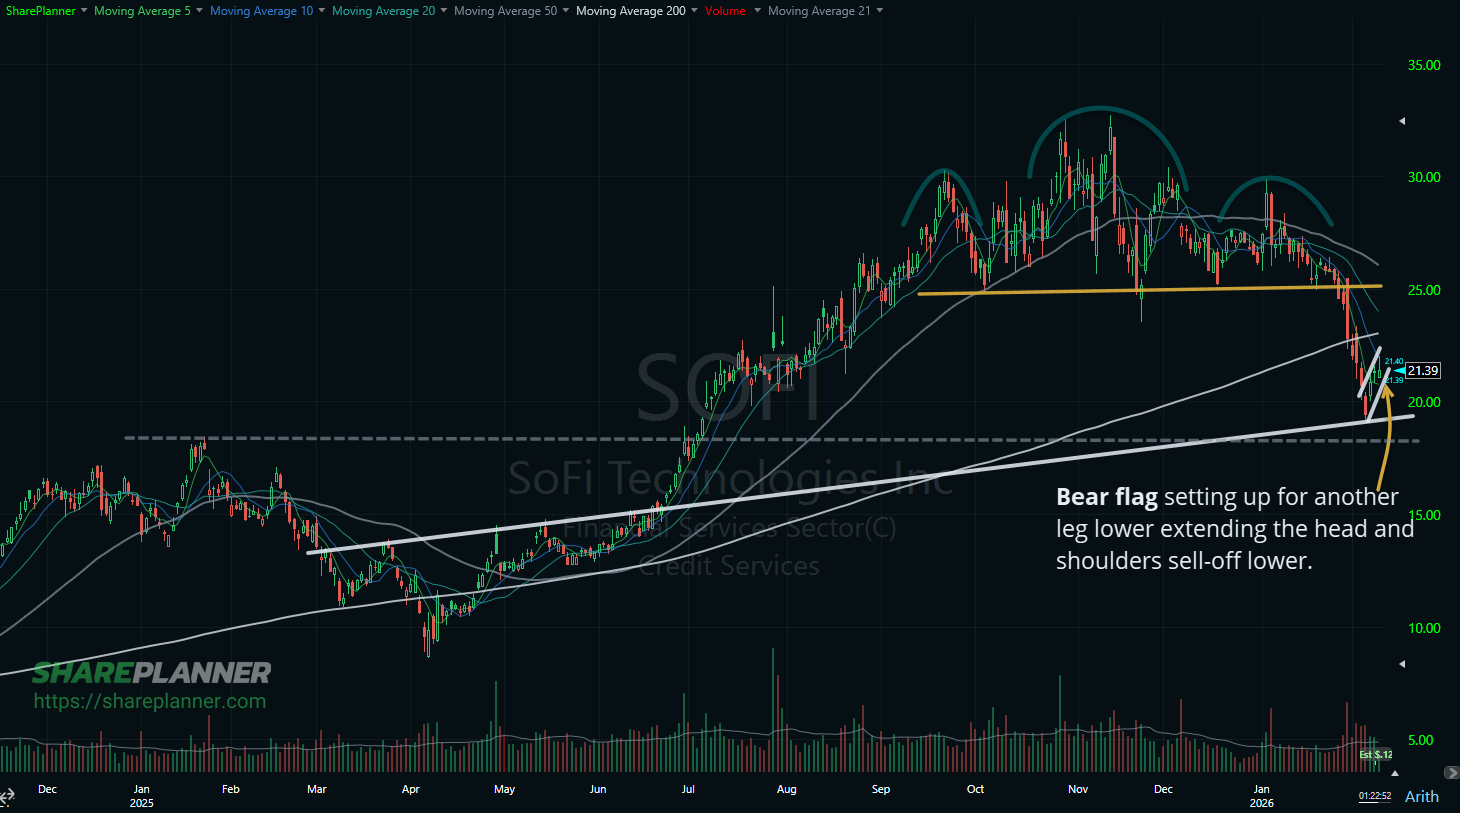
This breakdown matters. It signaled that the buyers who supported the stock were losing control. When patterns like this confirm, the shift is often not a one-day event. It can change the psychology of the stock for weeks or months.
Many traders see the drop and think it is a discount. They try to catch the falling knife because they remember where the stock used to trade. But after a head and shoulders confirmation, “cheap” often gets cheaper.
The Developing Bear Flag
After the head and shoulders breakdown, SOFI found temporary support. It bounced and drifted higher for a few days. To the untrained eye, this looks like a recovery.
But when you look at the structure, it resembles a bear flag. A bear flag is a continuation pattern. It forms when a stock drops hard, then drifts higher on lighter volume. It is a pause, not a reversal.
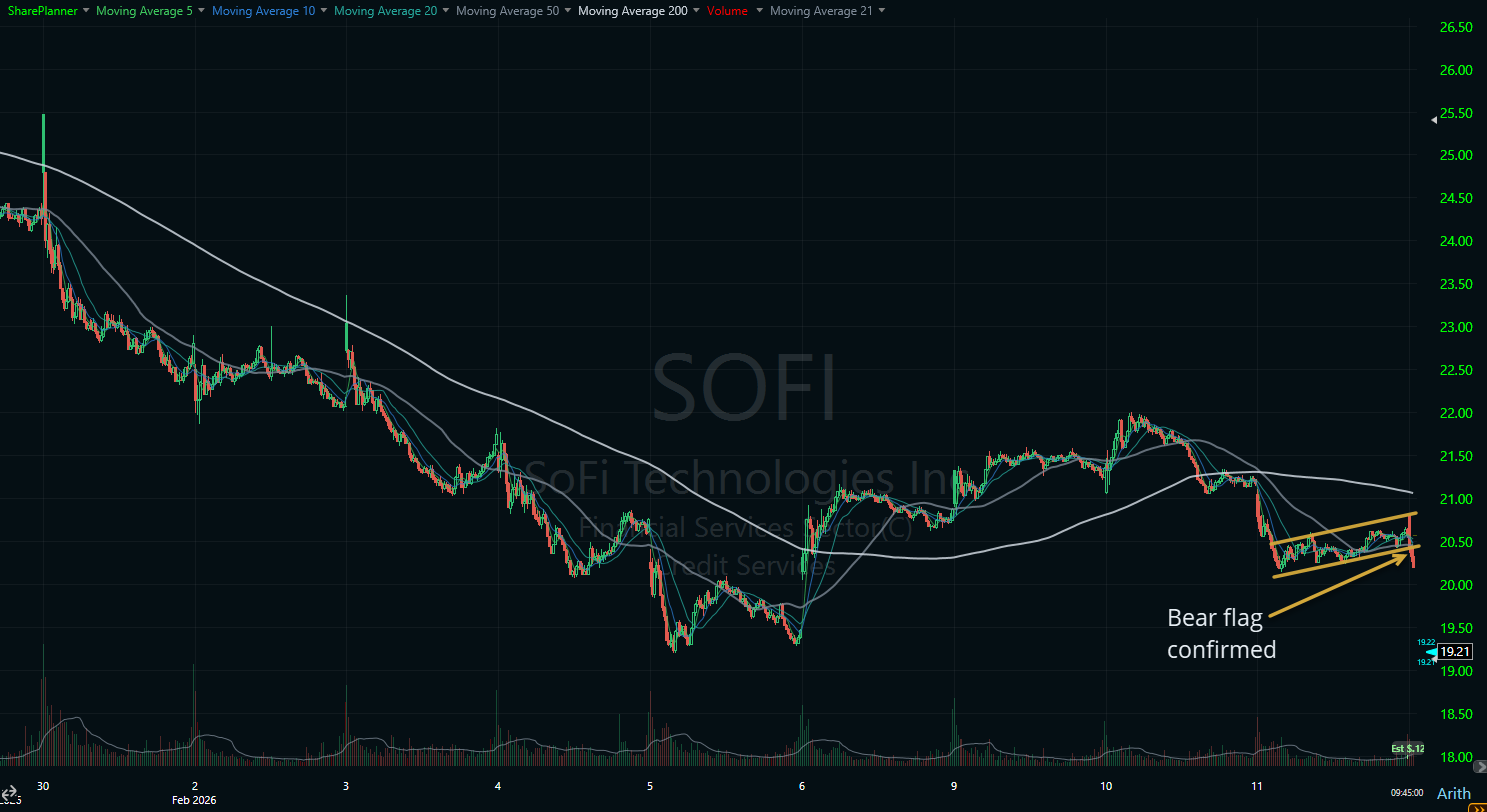
Short sellers take profits after the initial drop, and bottom fishers try to catch the low. But conviction is usually weak. Volume is uninspiring and price action turns choppy.
This consolidation also allows moving averages to catch up. It resets oversold conditions and sets the stage for the next leg lower. If price breaks down through the lower support line of the flag, selling often resumes with strength.
Why Support Likely Won’t Hold
The current bounce is happening off support, which is normal. Stocks rarely fall in a straight line. They stair-step down, bounce, and then break through the floor.
I do not expect this support to hold for SOFI. The selling pressure from the head and shoulders breakdown is still the dominant force. Overhead supply from trapped buyers is heavy. Traders who bought during the right shoulder are underwater. As price drifts higher, many will sell just to get back to break-even, creating a ceiling on the bounce.
Market context matters too. If the broader market rolls over or even goes sideways, high-beta growth stocks like SOFI are often the first to get hit. They rely on risk appetite. When investors get cautious, speculative names get dumped first.
If SOFI breaks down from the bear flag, the next leg lower can be meaningful. A common target is the length of the initial drop projected from the breakdown point, which implies downside beyond the recent lows.
Managing Risk on the Short Side
If you choose to short SOFI based on this setup, risk management is non-negotiable. Shorting can be dangerous. Squeezes happen. Headlines happen. You need to know exactly where you are wrong before you enter.
In a bear flag, a move above the upper trendline usually invalidates the setup. If SOFI rallies with strength and reclaims the key breakdown level from the head and shoulders, the bearish thesis is broken.
Here is a simple way to structure the trade:
- Entry: Look for a break below the lower trendline of the bear flag, or consider an entry near the top of the flag with a tight stop.
- Stop-loss: Place the stop above the recent flag high or above a key moving average that sits above the flag.
- Target: Measure the initial drop and project it downward from the breakdown point.
Position sizing matters. Even great setups can fail. If you size correctly, a loss is a small paper cut, not an account-ending event.
Avoiding the Hope Trap
The biggest enemy of a swing trader is hope. It shows up most in stocks with strong narratives. Traders get trapped long and instead of cutting losses, they search for reasons to stay in. They consume bullish content and convince themselves the market is wrong.
This is how small losses become disasters. When you trade with hope, you are not analyzing. You are wishing.
With SOFI, the trend is down and the patterns are bearish. If you are long, ask yourself whether you are holding because the chart supports it or because you want the company to succeed. Those are two different things.
If you are short, do not get arrogant. The market can stay irrational longer than you can stay solvent. Follow your plan, take profits responsibly, and trail stops to protect gains. Treat it like a business, not a casino.
Let the Chart Be Your Guide
The setup on SOFI is clear. A confirmed head and shoulders breakdown followed by a developing bear flag creates a bearish framework. Sellers are in control and buyers are struggling to regain momentum.
But trading is never certainty. It is probability and risk management. Identify the setup, execute the plan, and manage risk. If it works, great. If it fails, exit small and move on.
Do not let your opinion of the company override the chart. The chart is the truth for swing traders, and right now the truth points lower.
Frequently Asked Questions About SoFi Stock
Why is SOFI bearish right now?
SOFI is bearish because it confirmed a head and shoulders breakdown and is now forming a bear flag, which is often a continuation pattern lower.
What does a head and shoulders confirmation mean?
A head and shoulders confirmation occurs when price breaks below the neckline. It often signals a shift in trend and can lead to sustained downside movement.
What is a bear flag pattern?
A bear flag occurs after a sharp drop, followed by a small upward drift on lighter volume. It is usually a pause before selling resumes.
Where is a logical stop-loss on a SOFI short?
A common stop is above the upper trendline of the bear flag or above the most recent swing high of the flag. If price breaks above that level, the setup is often invalidated.
Can bearish patterns fail in a bull market?
Yes. In strong market environments, breakdowns can fail and turn into squeezes. That is why confirmation and strict risk management are essential.
What is the biggest mistake traders make with bearish setups?
The biggest mistake is ignoring risk management. Traders either oversize the position or refuse to exit when the thesis is invalidated.


Welcome to Swing Trading the Stock Market Podcast!
I want you to become a better trader, and you know what? You absolutely can!
Commit these three rules to memory and to your trading:
#1: Manage the RISK ALWAYS!
#2: Keep the Losses Small
#3: Do #1 & #2 and the profits will take care of themselves.
That’s right, successful swing-trading is about managing the risk, and with Swing Trading the Stock Market podcast, I encourage you to email me (ryan@shareplanner.com) your questions, and there’s a good chance I’ll make a future podcast out of your stock market related question.
Refusing to take a loss when the trade has turned, and the reason for getting into the trade in the first place is no longer valid, is one of the biggest problems traders face. In this video, Ryan Mallory discusses the pitfalls that comes with refusing to take the loss and instead opting to become a bagholder on one's trades.
Be sure to check out my Swing-Trading offering through SharePlanner that goes hand-in-hand with my podcast, offering all of the research, charts and technical analysis on the stock market and individual stocks, not to mention my personal watch-lists, reviews and regular updates on the most popular stocks, including the all-important big tech stocks. Check it out now at: https://www.shareplanner.com/premium-plans
📈 START SWING-TRADING WITH ME! 📈
Click here to subscribe: https://shareplanner.com/tradingblock
— — — — — — — — —
💻 STOCK MARKET TRAINING COURSES 💻
Click here for all of my training courses: https://www.shareplanner.com/trading-academy
– The A-Z of the Self-Made Trader –https://www.shareplanner.com/the-a-z-of-the-self-made-trader
– The Winning Watch-List — https://www.shareplanner.com/winning-watchlist
– Patterns to Profits — https://www.shareplanner.com/patterns-to-profits
– Get 1-on-1 Coaching — https://www.shareplanner.com/coaching
— — — — — — — — —
❤️ SUBSCRIBE TO MY YOUTUBE CHANNEL 📺
Click here to subscribe: https://www.youtube.com/shareplanner?sub_confirmation=1
🎧 LISTEN TO MY PODCAST 🎵
Click here to listen to my podcast: https://open.spotify.com/show/5Nn7MhTB9HJSyQ0C6bMKXI
— — — — — — — — —
💰 FREE RESOURCES 💰
— — — — — — — — —
🛠 TOOLS OF THE TRADE 🛠
Software I use (TC2000): https://bit.ly/2HBdnBm
— — — — — — — — —
📱 FOLLOW SHAREPLANNER ON SOCIAL MEDIA 📱
FACEBOOK: https://facebook.com/shareplanner
*Disclaimer: Ryan Mallory is not a financial adviser and this podcast is for entertainment purposes only. Consult your financial adviser before making any decisions.

You Might Like

South Korea: The Hidden Driver of US Tech Volatility

Stop Trying to Hit Home Runs: Start Trading Within Your Means

How to Trade Breakouts Without Getting Trapped