
If you have been watching Nvidia lately, you have probably noticed the excitement has cooled off. The stock that led the market higher has gone nowhere for months. It has churned sideways, frustrating traders who are used to parabolic upside.
Now the chart is showing something more ominous than boredom. A large head and shoulders pattern has formed on the daily chart. This is one of the most well-known bearish reversal patterns, and it suggests the uptrend may be exhausting.
But trading is rarely that simple. Context matters. We are in a strong bull market where market leaders can defy gravity. Shorting a leader in that environment can be dangerous.
This creates a dilemma for swing traders. Do you trust the pattern and bet on a breakdown, or do you respect the bull market and wait for confirmation? In this post, I will break down what I am seeing in Nvidia (NVDA), the key levels to watch, and how to manage risk so you do not get run over by a potential bear trap.
The Technical Breakdown of NVDA
Nvidia has spent the last several months building this structure. The left shoulder formed first, followed by the rally to new highs that created the head. Since then, the stock failed to regain those highs and formed a lower high, giving us the right shoulder.
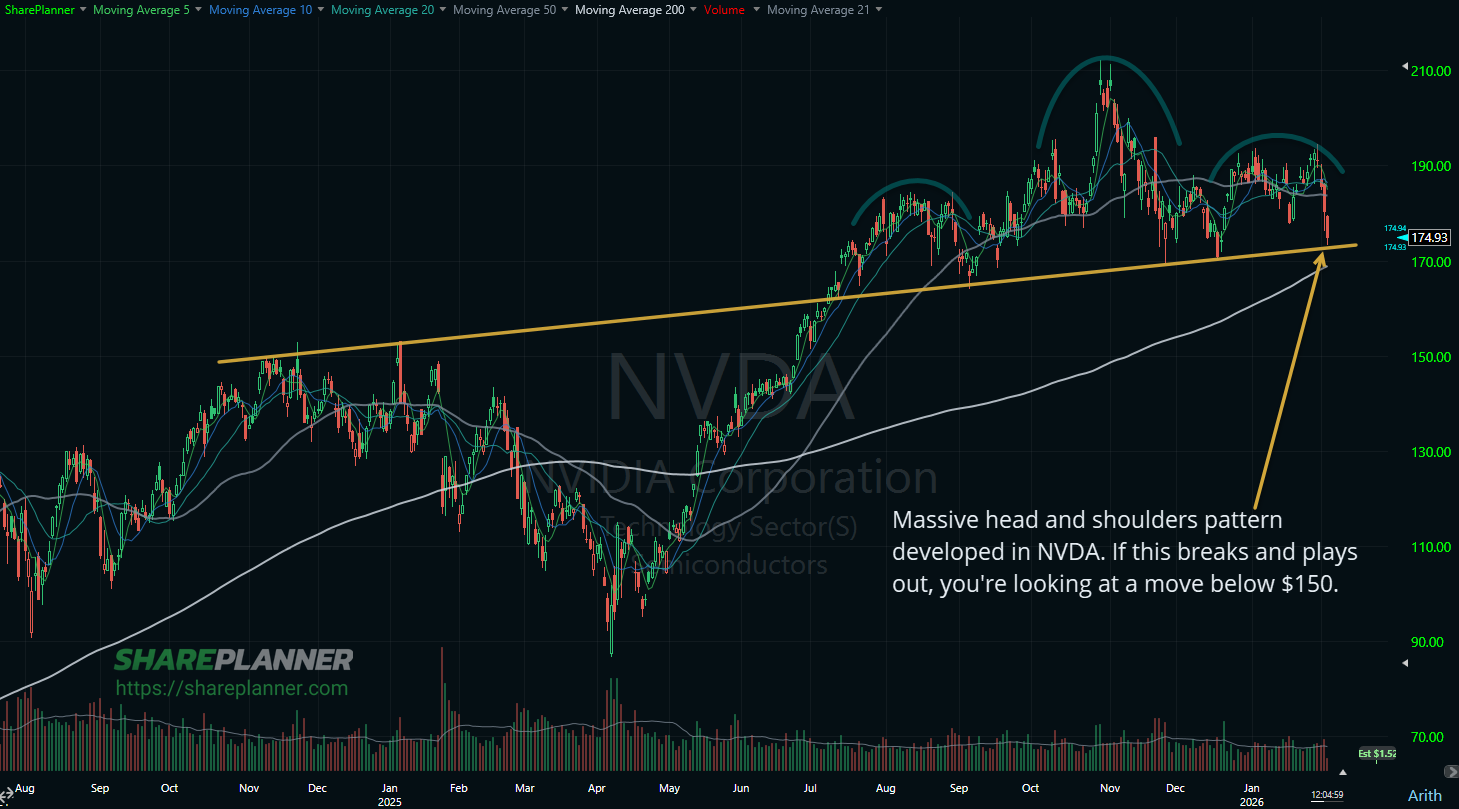
The most important level in this setup is the neckline. It has acted as support multiple times. If price breaks below the neckline with strong volume, the pattern is confirmed.
If that breakdown occurs, the measured move can be meaningful. Measure the distance from the top of the head down to the neckline and project it below the neckline. Based on the current structure, that suggests a move below $150, which would be a significant correction for a stock many treat as untouchable.
Why You Must Be Careful in a Bull Market
This is where you need to slow down. Head and shoulders patterns have a notorious history of failing in strong bull markets. They often lure bears in, then rip higher and squeeze them out.
Everyone sees the same pattern. Retail traders buy puts. Short sellers pile in. Then, just as the stock appears to break down, buyers defend support and a short squeeze erupts.
It is a head fake. The market convinces you the trend is over, only for it to resume with even more strength. Betting against a market leader in a strong tape is a high-risk play.

Managing the Risk on the Trade
This is not a prediction trade. It is a reaction trade.
I am not interested in front-running the breakdown. I want to see a confirmed close below the neckline before considering the short side. Even then, position sizing should be smaller than usual because reversal risk is high.
If you do short a confirmed break, you need a hard stop. A logical stop is above the right shoulder. If price reclaims that level, the thesis is broken and you exit. No hoping.
Personally, I would prefer to let the first leg lower play out with no position. Then wait for the dead-cat bounce back toward the neckline. If that neckline fails on the retest and the broader market is also weakening, that is the higher-quality short entry.
Checklist for the Trading Setup
Here is the checklist for trading this setup:
- Patience is key: Do not jump on the first drop. Let the first leg down and the bounce play out.
- Watch the neckline: This is the line in the sand. A failure on the retest is a major signal.
- Confirm with the market: If the broader market is strong, the neckline can become a launchpad higher. Weak markets support short setups.
- Execute and manage: If the neckline fails and the market confirms, take the trade and place the stop at a level that fits your risk parameters.
The Bullish Case for Failure
There is another way to play this, and it may be the higher-probability path given the market environment. If the head and shoulders fails, it can become a powerful bullish signal.
When bearish patterns fail, they trap shorts. As they cover, they become buyers, which adds fuel to the upside. That can launch the stock back toward the highs of the head.
If Nvidia holds the neckline and curls higher, or if it breaks down briefly and then reclaims the neckline, that is a signal to lean bullish. Failed breakdowns can be stronger signals than the pattern itself.
Don’t Let Paranoia Dictate Your Trade
It is tempting to look at this and think you found the big short. But trading is probabilities, not certainties.
Nvidia has had insatiable demand for years. Price action has stalled, but the longer-term trend is still intact until proven otherwise.
Do not let the desire to call a top cloud judgment. If a trade goes against you, take the small loss and move on. Do not argue with the tape.
Patience Is Your Best Position
Right now, the best trade may be no trade. Cash is a position. Waiting for clarity is a skill that separates pros from gamblers.
Let Nvidia prove direction. If it breaks the neckline with authority, you may have a short setup. If it holds and bounces, you may have a long setup with defined risk below the neckline.
Whatever you do, manage risk first. Keep losses small. If you do that, profits tend to take care of themselves.
Become part of the Trading Block and get my trades, and learn how I manage them for consistent profits. With your subscription you will get my real-time trade setups via Discord and email, as well as become part of an incredibly helpful and knowledgeable community of traders to grow and learn with. If you’re not sure it is for you, don’t worry, because you get a Free 7-Day Trial. So Sign Up Today!
Frequently Asked Questions About the NVDA Head and Shoulders Pattern
What is a head and shoulders pattern?
A head and shoulders pattern is a bearish reversal formation made of a left shoulder, a higher peak (the head), and a lower peak (the right shoulder). It often signals a potential trend change if support breaks.
What is the neckline in a head and shoulders pattern?
The neckline is the support level connecting the lows between the shoulders and the head. A breakdown below the neckline is what confirms the pattern.
Does a head and shoulders pattern always work?
No. In strong bull markets, head and shoulders patterns can fail and turn into bull traps for short sellers. Confirmation and context matter.
When is the safest time to short a head and shoulders pattern?
The safer approach is after a confirmed close below the neckline, ideally followed by a retest where the neckline fails as resistance.
What invalidates the bearish head and shoulders setup?
A strong reclaim of the neckline after a breakdown, or a move back above the right shoulder, often invalidates the bearish thesis.
What happens if the pattern fails?
A failed head and shoulders can be bullish because it traps shorts. Short covering can fuel a strong move back toward prior highs.


Welcome to Swing Trading the Stock Market Podcast!
I want you to become a better trader, and you know what? You absolutely can!
Commit these three rules to memory and to your trading:
#1: Manage the RISK ALWAYS!
#2: Keep the Losses Small
#3: Do #1 & #2 and the profits will take care of themselves.
That’s right, successful swing-trading is about managing the risk, and with Swing Trading the Stock Market podcast, I encourage you to email me (ryan@shareplanner.com) your questions, and there’s a good chance I’ll make a future podcast out of your stock market related question.
Refusing to take a loss when the trade has turned, and the reason for getting into the trade in the first place is no longer valid, is one of the biggest problems traders face. In this video, Ryan Mallory discusses the pitfalls that comes with refusing to take the loss and instead opting to become a bagholder on one's trades.
Be sure to check out my Swing-Trading offering through SharePlanner that goes hand-in-hand with my podcast, offering all of the research, charts and technical analysis on the stock market and individual stocks, not to mention my personal watch-lists, reviews and regular updates on the most popular stocks, including the all-important big tech stocks. Check it out now at: https://www.shareplanner.com/premium-plans
📈 START SWING-TRADING WITH ME! 📈
Click here to subscribe: https://shareplanner.com/tradingblock
— — — — — — — — —
💻 STOCK MARKET TRAINING COURSES 💻
Click here for all of my training courses: https://www.shareplanner.com/trading-academy
– The A-Z of the Self-Made Trader –https://www.shareplanner.com/the-a-z-of-the-self-made-trader
– The Winning Watch-List — https://www.shareplanner.com/winning-watchlist
– Patterns to Profits — https://www.shareplanner.com/patterns-to-profits
– Get 1-on-1 Coaching — https://www.shareplanner.com/coaching
— — — — — — — — —
❤️ SUBSCRIBE TO MY YOUTUBE CHANNEL 📺
Click here to subscribe: https://www.youtube.com/shareplanner?sub_confirmation=1
🎧 LISTEN TO MY PODCAST 🎵
Click here to listen to my podcast: https://open.spotify.com/show/5Nn7MhTB9HJSyQ0C6bMKXI
— — — — — — — — —
💰 FREE RESOURCES 💰
— — — — — — — — —
🛠 TOOLS OF THE TRADE 🛠
Software I use (TC2000): https://bit.ly/2HBdnBm
— — — — — — — — —
📱 FOLLOW SHAREPLANNER ON SOCIAL MEDIA 📱
FACEBOOK: https://facebook.com/shareplanner
*Disclaimer: Ryan Mallory is not a financial adviser and this podcast is for entertainment purposes only. Consult your financial adviser before making any decisions.

You Might Like

South Korea: The Hidden Driver of US Tech Volatility

Stop Trying to Hit Home Runs: Start Trading Within Your Means

How to Trade Breakouts Without Getting Trapped