
I must admit that I am surprised by the bullishness today. With no news, and no real motivation for the bulls to push the markets higher, I thought that we would see some profit taking ahead of the weekend. But so far this morning that has not been the case. I’ve provided the daily chart

The bulls are letting if fly today, and ramping this market up as high as it possibly can. I’m pretty confident that despite what CNBC is saying, that markets were going to rally today regardless of whether the news was good or bad. This rally, or at least the strength of it, caught me off

Below is a two-year look at the T2108 Oversold/Overbought indicator. We are still in the mid-range just like we were last week. In fact, there hasn’t really been much damage to the prices of stocks from the week prior to this past week. The prior week’s reading came in at 50.07, while this week’s T2108

Last week has to go down as one of the craziest trading weeks of the year. There was a lot of money gained and lost, and depending on what side of the trade you were on, you either cursed the market or embraced it. If you remained on the sidelines, then you probably were smarter

Head and Shoulders patterns abound. The neckline (support) on one has been broken, and the other is still in play. Here is the short-term head and shoulders pattern that was broken on Monday…

Below is a two-year look at the T2108 Oversold/Overbought indicator. We are basically in the mid-range showing no significant extremes. I would expect us to dip below the 20’s before the market begins reversing to any large extent. The T2108’s purpose is to measure the percentage of stocks trading above their 40-day moving average. There

The week’s early rally off-set for the most part the selling the market saw in the latter part of the week, namely Thursday and Friday. What I would like to see the bears do at this point, and to a large extent has been unsuccessful at, is to see MULTIPLE days where we go down
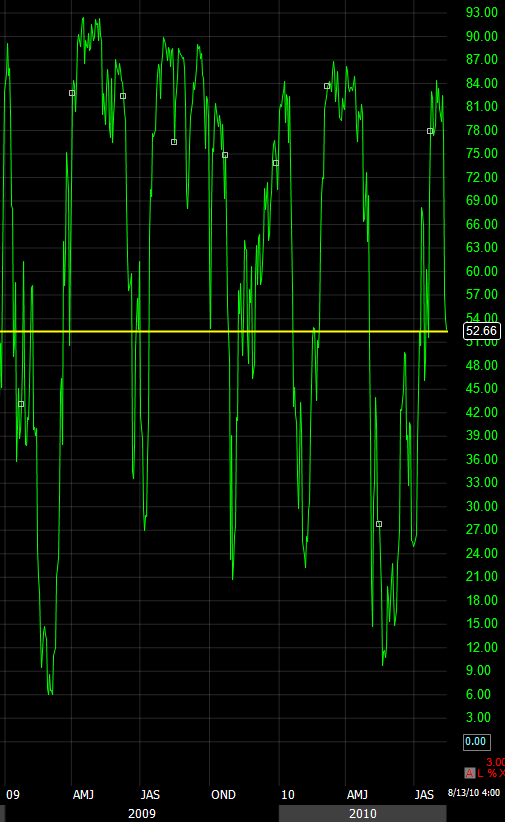
Here’s an update on the T2108 going back about a year and a half – as you can see, the market is quickly coming off of its overbought conditions seen for most of the past month and shows a lot of potential still for more downside to this market. The T2108’s purpose is to measure

The bulls took a beating last week, and the NYSE Reverseal Indicator clearly shows as much. In fact, the picture doesn’t get any better. Historically when %K and %D lines cross to the downside (explained below), within a matter of a week or two, we get significant and sustained pressures. Only once or twice in

spc@shareplanner.com
(904) 800-8420
© Copyright 2025 | SharePlanner Inc. All Rights Reserved.
Disclaimer: The information provided on this website is for educational and informational purposes only. Ryan Mallory and/or SharePlanner are not licensed financial advisors, brokers, or tax professionals. The content on this site should not be considered as financial, investment, tax, or legal advice.
All information and opinions expressed herein are based on sources believed to be accurate and reliable. However, we make no representation or warranty as to their accuracy, completeness, or reliability. Any action you take upon the information on this website is strictly at your own risk.
Past performance is not indicative of future results. Investing involves risk, including the possible loss of principal. All investors should make their own decisions based on their specific investment objectives and financial circumstances.
This site may contain links to external websites that are not provided or maintained by or in any way affiliated with Ryan Mallory and/or SharePlanner. Please note that Ryan Mallory and/or SharePlanner do not guarantee the accuracy, relevance, timeliness, or completeness of any information on these external websites.
By using this website, you agree that Ryan Mallory and/or SharePlanner and any affiliated parties are not responsible for any losses or damages resulting from your use of or reliance on the information provided.
It is strongly recommended that you consult with a qualified professional before making any financial decisions.