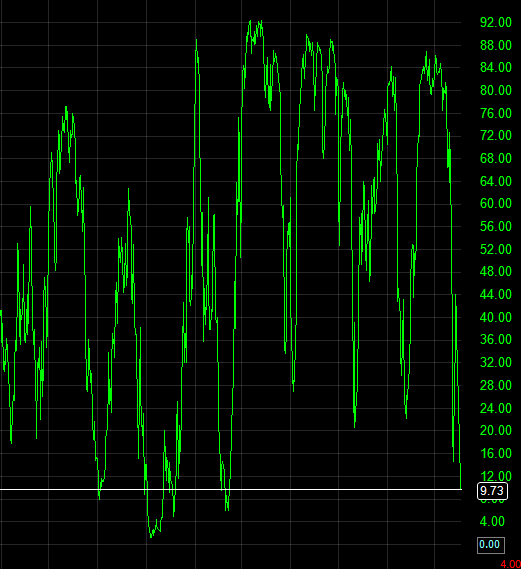
What a week we have had – for the bears it was one for the books – as for me, one of the best couple of weeks of trading that I have ever had. The T2108 shows exactly how oversold we are, and to be initiating new short positions at these levels is boarderline insane,
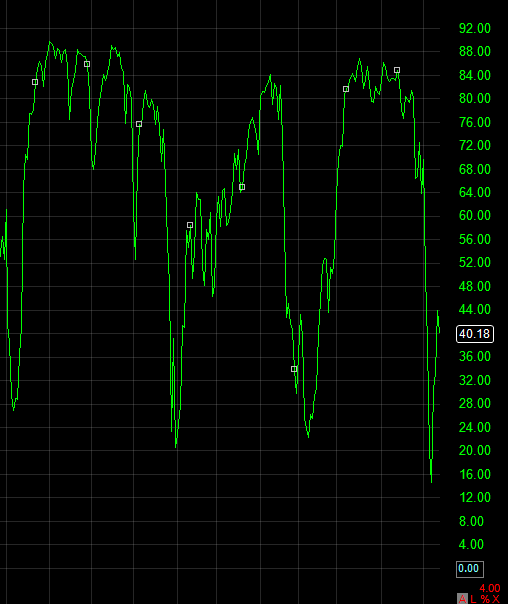
The week is almost over, and as you can clearly see the T2108 got a nice bounce from the market’s action on Monday and Wednesday. I’m short to the gills right now, so I’m looking for tomorrow to continue with what we saw this afternoon in the markets – and that is more and more
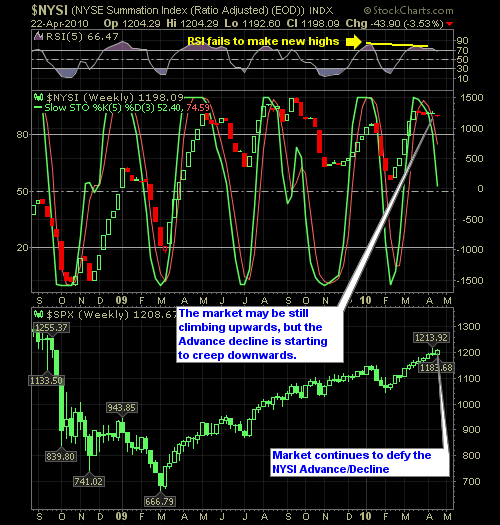
Here is one of my favorite ways of measuring oversold/overbought levels by using the stochastics that is overlaying the weekly NYSI Advance/Decline of stocks. Here you can see the stochastics are pulling back quite a bit while the advance/decline itself is only moderately coming down. On the other hand the RSI is leading the way

There was a number of creative titles I could have given this article like “Markets Gone Wild”, “Pay-Day Some-Day” among others, but I figured I’d be a little bit more to the point – and that’s what I did. Don’t think for a second that history can’t repeat itself, because it can and it does
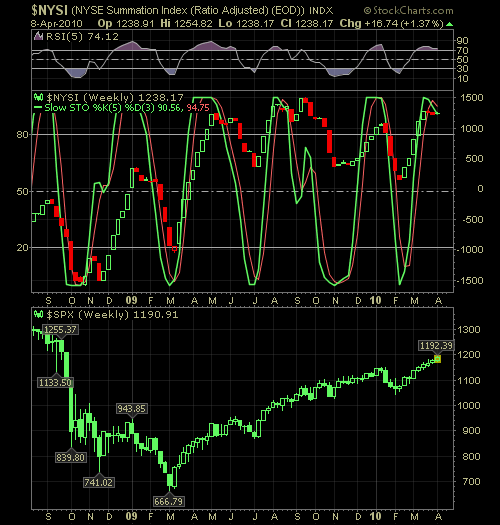
As has been the case for the past few weeks, I have used Friday to post a chart on one of my favorite ways of measuring oversold/overbought levels by using the stochastics that is overlaying the weekly NYSI Advance/Decline of stocks. Like last week, we are showing some overbought levels, that in the past, has

As has always been the case for over a year now, the market is still moving upwards, though of late it seems to be doing so at a more grinding pace. It nonetheless though, is still holding the trendline. One of the major developments I’m noticing is with the S&P and how the volume just

For the past few weeks I have been providing you with the chart below, because, as I have been saying for eternity now, the market is looking prime for a pullback of some kind. Despite the market being closed today, it still managed to rally in the futures markets off of the unemployment report that
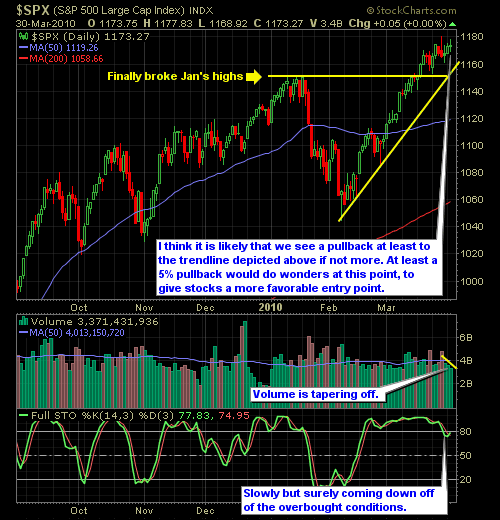
Not much has changed in the market over the past six trading days as it has essentially been in a sideways/consolidation pattern. This tends to erode positions in the direction of the current trend, as stocks have a difficulty at holding significant gains, when the market isn’t continuing to press forward. I sold my positions

From time to time, I post a the chart below to show how overbought/oversold we truly are in this current market. Over the past couple of years, when this overbought indicator starts banging its head against the ceiling of the parameters that measure it, we have typically see an imminent downturn, if only it lasts a

If there is one constant theme week-in and week-out that I provide in the technical analysis on the market, it is this: THE MARKET GOES UP NO MATTER WHAT! Unemployment rises – market goes up! Federal Gov’t takes over the health sector – market goes up! Greece on the verge of going belly-up – market

spc@shareplanner.com
(904) 800-8420
© Copyright 2025 | SharePlanner Inc. All Rights Reserved.
Disclaimer: The information provided on this website is for educational and informational purposes only. Ryan Mallory and/or SharePlanner are not licensed financial advisors, brokers, or tax professionals. The content on this site should not be considered as financial, investment, tax, or legal advice.
All information and opinions expressed herein are based on sources believed to be accurate and reliable. However, we make no representation or warranty as to their accuracy, completeness, or reliability. Any action you take upon the information on this website is strictly at your own risk.
Past performance is not indicative of future results. Investing involves risk, including the possible loss of principal. All investors should make their own decisions based on their specific investment objectives and financial circumstances.
This site may contain links to external websites that are not provided or maintained by or in any way affiliated with Ryan Mallory and/or SharePlanner. Please note that Ryan Mallory and/or SharePlanner do not guarantee the accuracy, relevance, timeliness, or completeness of any information on these external websites.
By using this website, you agree that Ryan Mallory and/or SharePlanner and any affiliated parties are not responsible for any losses or damages resulting from your use of or reliance on the information provided.
It is strongly recommended that you consult with a qualified professional before making any financial decisions.