Another position to add to the portfolio, which brings my total to eight long positions and not a single short. This stock is an absolute beauty and from a technical standpoint, you’ll be hard pressed to find one that looks better. I’m long at $24.05 but there are a number of other traders from the
I haven’t taken a long position in anything since Thursday, as I stood on the sidelines on Friday. But the market is showing healthy signs of rebounding today and moving back into the green before today’s close. One industry that just seems to be taking a beating of late are the discount clothing retailers, so
I think this is the third time that Dunkin Brands (DNKN) has make it to the Lazy Trade Spot Light. And each time it hasn’t let us down either. So there is some definitely possibilities with this one again as it rises back into the upperband of the declining channel. Invensense (INVN) comes from another
I was stopped out of the second half of my trade in GT Technologies (GTAT) at $6.67 at the open. My original buy-in was 6.73 so that is less than a 1.0% loss. The good thing is that I sold half yesterday at $7.01. Combined together that actually makes for a respectable gain of 1.6%
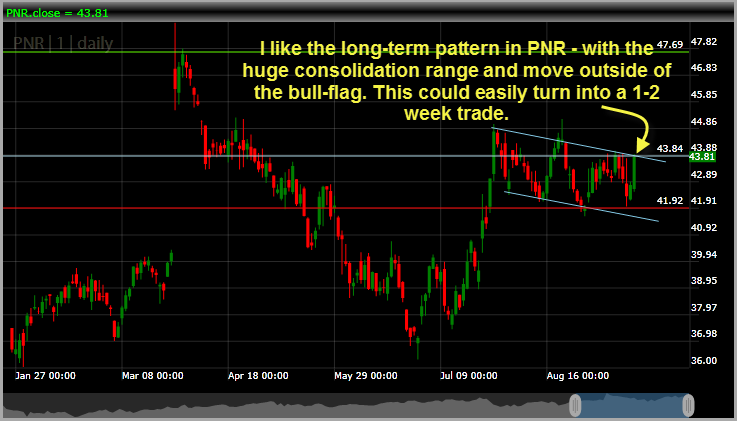
My only trade so far (nothing closed out either at this point) comes in Pentair (PNR) at $43.85. Initially when i got in it, it rocketed up to $44.40 but has since pulled back again to my entry price. The pullback is actually very necessary as it was getting extremely over-extended on the 5min-intraday chart.

With a new round of Quantitative Easing comes a new wave of dip-buying, where every opportunity the market gives you to buy a stock cheaper than the day before, investors seize upon. And with QE3 upon us, it won’t be no different this time around. So with that, I bring you the “buy-the-dip” edition of
I was stopped out of Green Mountain Coffee Roasters (GMCR) this morning for a -4.5% loss, but have just now replaced it with a new position in Sears Holding (SHLD) with a buy-in at $61.10. So far so good, and the market is showing signs of the bulls coming back to the table here and
As a follow-up post to the one I did last week on How Big Should I Trade, I want to focus on “When I Should Not Be Trading”. This is a little bit more straight forward that will focus on the more subtle traits for when you know you should just ‘hang it up.” First
So far today I’ve made two new long trades on the day – the first one in Green Mountain Coffee Roasters (GMCR) at $31.74 and the second in GT Advanced Technologies (GTAT) at $6.73 – so far I’m getting the feeling of being duped on my timing on the entry in conjunction with the market. But
I’ve initiated my first short trade in more than a month, not because I think this market is going south anytime soon, but I do believe that there is an opportunity to make a profit off of an obvious overbought market. As a result, I want to protect some of my existing profits without having

spc@shareplanner.com
(904) 800-8420
© Copyright 2025 | SharePlanner Inc. All Rights Reserved.
Disclaimer: The information provided on this website is for educational and informational purposes only. Ryan Mallory and/or SharePlanner are not licensed financial advisors, brokers, or tax professionals. The content on this site should not be considered as financial, investment, tax, or legal advice.
All information and opinions expressed herein are based on sources believed to be accurate and reliable. However, we make no representation or warranty as to their accuracy, completeness, or reliability. Any action you take upon the information on this website is strictly at your own risk.
Past performance is not indicative of future results. Investing involves risk, including the possible loss of principal. All investors should make their own decisions based on their specific investment objectives and financial circumstances.
This site may contain links to external websites that are not provided or maintained by or in any way affiliated with Ryan Mallory and/or SharePlanner. Please note that Ryan Mallory and/or SharePlanner do not guarantee the accuracy, relevance, timeliness, or completeness of any information on these external websites.
By using this website, you agree that Ryan Mallory and/or SharePlanner and any affiliated parties are not responsible for any losses or damages resulting from your use of or reliance on the information provided.
It is strongly recommended that you consult with a qualified professional before making any financial decisions.