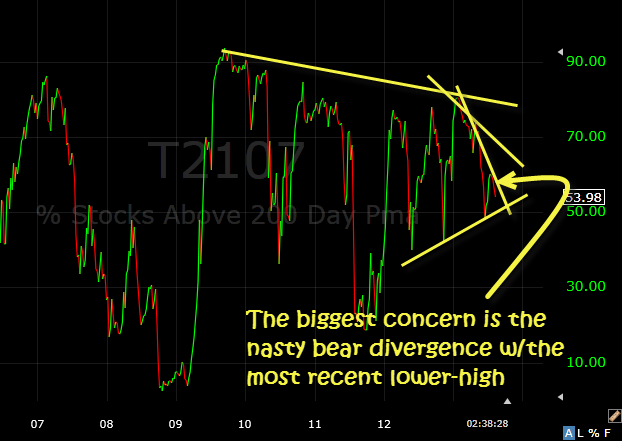
Typically a divergence on an indicator, especially as drastic as that on the T2107 foretells of a looming reversal in the market.
The T2107 measures the number of stocks trading above the 200-day moving average. What’s funny is that the SPX is so far above the 200-day moving average and hasn’t traded below it since November of 2012 – about nine months ago.
However, at this moment only 54% of those stocks are trading above the 200-day moving average.

The conclusion to draw here is that there is a lot more weakness in individual stocks than what the broader market is showcasing for everyone to see.
What is even more concerning is that back in May when the SPX hit all time highs, 70% of stocks were trading above the 200-day moving average. Not a great reading but okay nonetheless. but in July when the SPX crossed into 1700 for the first time less than 60% were doing the same thing.

So what should be concluded here is that we should be on guard for the potential of a strong move downward. May not happen this week or next, but eventually the divergence that we are seeing will be put to the text and you’ll need to make sure you are ready to respond appropriately.

Welcome to Swing Trading the Stock Market Podcast!
I want you to become a better trader, and you know what? You absolutely can!
Commit these three rules to memory and to your trading:
#1: Manage the RISK ALWAYS!
#2: Keep the Losses Small
#3: Do #1 & #2 and the profits will take care of themselves.
That’s right, successful swing-trading is about managing the risk, and with Swing Trading the Stock Market podcast, I encourage you to email me (ryan@shareplanner.com) your questions, and there’s a good chance I’ll make a future podcast out of your stock market related question.
In today's episode, I explain whether it is a good idea or not to rapidly increase the size of your portfolio if you come across a sum of cash. A lot of traders will do this without ever recognizing the emotional toll it can have on you as a swing trader and the awful mistakes you can make in doing so.
Be sure to check out my Swing-Trading offering through SharePlanner that goes hand-in-hand with my podcast, offering all of the research, charts and technical analysis on the stock market and individual stocks, not to mention my personal watch-lists, reviews and regular updates on the most popular stocks, including the all-important big tech stocks. Check it out now at: https://www.shareplanner.com/premium-plans
📈 START SWING-TRADING WITH ME! 📈
Click here to subscribe: https://shareplanner.com/tradingblock
— — — — — — — — —
💻 STOCK MARKET TRAINING COURSES 💻
Click here for all of my training courses: https://www.shareplanner.com/trading-academy
– The A-Z of the Self-Made Trader –https://www.shareplanner.com/the-a-z-of-the-self-made-trader
– The Winning Watch-List — https://www.shareplanner.com/winning-watchlist
– Patterns to Profits — https://www.shareplanner.com/patterns-to-profits
– Get 1-on-1 Coaching — https://www.shareplanner.com/coaching
— — — — — — — — —
❤️ SUBSCRIBE TO MY YOUTUBE CHANNEL 📺
Click here to subscribe: https://www.youtube.com/shareplanner?sub_confirmation=1
🎧 LISTEN TO MY PODCAST 🎵
Click here to listen to my podcast: https://open.spotify.com/show/5Nn7MhTB9HJSyQ0C6bMKXI
— — — — — — — — —
💰 FREE RESOURCES 💰
— — — — — — — — —
🛠 TOOLS OF THE TRADE 🛠
Software I use (TC2000): https://bit.ly/2HBdnBm
— — — — — — — — —
📱 FOLLOW SHAREPLANNER ON SOCIAL MEDIA 📱
*Disclaimer: Ryan Mallory is not a financial adviser and this podcast is for entertainment purposes only. Consult your financial adviser before making any decisions.


