
SharePlanner Reversal Indicator with different view points.
For years now I have been following the SPRI on a near daily basis and I’ve pretty much seen every signal that it can give off, particularly when trying to make sense of what the daily and weekly SPRI charts are trying to tell me simultaneously.
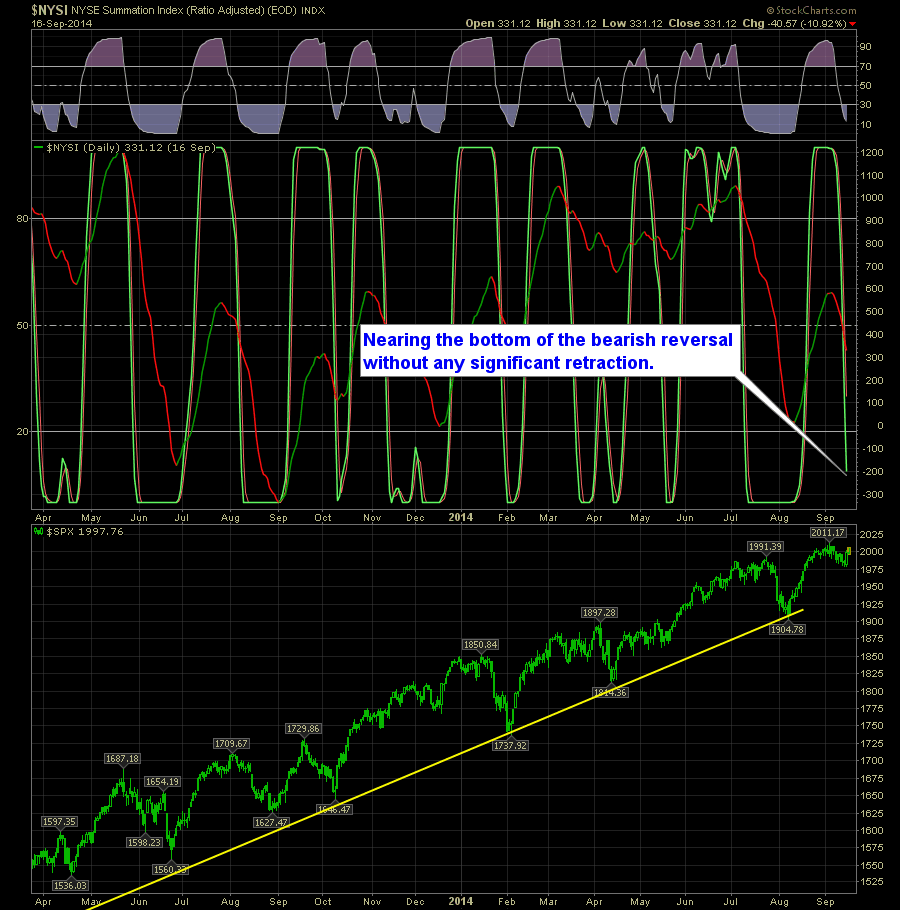
On the daily you can see where, despite a respectable sell-off of any kind, it has instead just drifted sideways, and made the September trading range tighter than what we saw in July. So as we are up against the FOMC Statement that will be coming out shortly, it appears to me that the SPRI is showing signs that the bear window on this market is quickly closing.
Here’s the Daily SPRI:
On the weekly, we have an early reversal, just like the one we saw in early May. From personal experience, those early reversals are very hard to trust. In fact more times than not they will, within a few weeks, reverse back higher and provide a nice “pop” for the market to the upside.
Here is the Weekly SPRI:

So right now I see a market that probably, has some upside left in it and I think that what we are seeing on the weekly is a false signal and the daily is showing signs that the bears are running out of steam, leaving the only option available is probably a move of some sort to the upside.


Welcome to Swing Trading the Stock Market Podcast!
I want you to become a better trader, and you know what? You absolutely can!
Commit these three rules to memory and to your trading:
#1: Manage the RISK ALWAYS!
#2: Keep the Losses Small
#3: Do #1 & #2 and the profits will take care of themselves.
That’s right, successful swing-trading is about managing the risk, and with Swing Trading the Stock Market podcast, I encourage you to email me (ryan@shareplanner.com) your questions, and there’s a good chance I’ll make a future podcast out of your stock market related question.
Watching the dollars rise and fall in your trading account can turn a well-planned swing trade into an emotional, deeply personal decision. In this episode, I explain why focusing on price action, percentage returns, and R-multiples can help you avoid cutting winners early, holding losers too long, and abandoning your trading plan.
Be sure to check out my Swing-Trading offering through SharePlanner that goes hand-in-hand with my podcast, offering all of the research, charts and technical analysis on the stock market and individual stocks, not to mention my personal watch-lists, reviews and regular updates on the most popular stocks, including the all-important big tech stocks. Check it out now at: https://www.shareplanner.com/premium-plans
📈 START SWING-TRADING WITH ME! 📈
Click here to subscribe: https://shareplanner.com/tradingblock
— — — — — — — — —
💻 STOCK MARKET TRAINING COURSES 💻
Click here for all of my training courses: https://www.shareplanner.com/trading-academy
– The A-Z of the Self-Made Trader –https://www.shareplanner.com/the-a-z-of-the-self-made-trader
– The Winning Watch-List — https://www.shareplanner.com/winning-watchlist
– Patterns to Profits — https://www.shareplanner.com/patterns-to-profits
– Get 1-on-1 Coaching — https://www.shareplanner.com/coaching
— — — — — — — — —
❤️ SUBSCRIBE TO MY YOUTUBE CHANNEL 📺
Click here to subscribe: https://www.youtube.com/shareplanner?sub_confirmation=1
🎧 LISTEN TO MY PODCAST 🎵
Click here to listen to my podcast: https://open.spotify.com/show/5Nn7MhTB9HJSyQ0C6bMKXI
— — — — — — — — —
💰 FREE RESOURCES 💰
— — — — — — — — —
🛠 TOOLS OF THE TRADE 🛠
Software I use (TC2000): https://bit.ly/2HBdnBm
— — — — — — — — —
📱 FOLLOW SHAREPLANNER ON SOCIAL MEDIA 📱
*Disclaimer: Ryan Mallory is not a financial adviser and this podcast is for entertainment purposes only. Consult your financial adviser before making any decisions.

You Might Like

South Korea: The Hidden Driver of US Tech Volatility

Stop Trying to Hit Home Runs: Start Trading Within Your Means

How to Trade Breakouts Without Getting Trapped